
I had a little problem last week. I built a very small website – really just a one pager with a single API – whacked it up on an Azure website and then promptly had a quarter of a million people visit it in three days. Uh, bugger?
Ok, what’s behind the website is a little more clever than that but the real point is that I didn’t expect it to take off so quickly. This leads to interesting problems; for example I wasn’t aware that the “Shared” Azure website I was using is limited to 20,000 page views a day. I did eight times that in one day. It broke. Well actually, Azure just turned the site off and fortunately someone told me within a few minutes and I just moved the slider over one to make it a “Standard” site. Crisis over.
The real issue though was bandwidth. Now this is a very well optimised site to begin with plus it’s very simple but still, you serve enough requests and your usage starts looking like this:
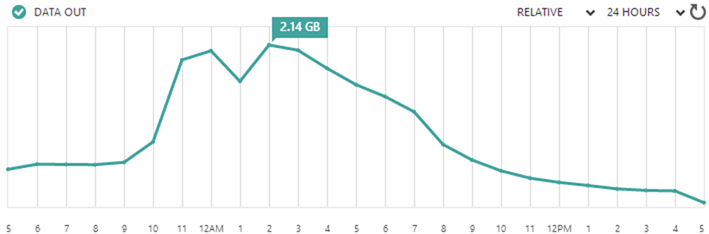
That’s just over 23GB in 24 hours from a very small site. Despite how well optimised the site was for speed, I realised that it wasn’t well optimised for egress data on the service I was paying for. I realised, for example, that I’d served up 15GB of jQuery alone – that’s minified and HTTP compressed too. Crikey.
There are a whole different set of challenges involved when optimising for large traffic volumes, let me walk you through how I tackled it.
Optimising early
Let me start by recapping on how the site was structured to begin with. If it hadn’t had been so well optimised from the outset I might have had a serious cost problem when things got big! Many sites these days are loading up a couple of MB just to get into the front page; if that had been my case one week into this project, I’d be looking at about a terabyte of data hitting my wallet which even at Azure’s excellent prices is many hundreds of dollars per month.
Moving on, the site uses Bootstrap, jQuery and Font Awesome, all of which were bundled and minified to ensure one request for CSS and one for JS. The CSS was loaded early and the JS was loaded late, the latter even bundling the Google Analytics code into the external script file to ensure it was cached.
Speaking of cache, all static resources were given a far-reaching cache expiration of one year. Of course they were all also served gzipped which is the default position for Azure anyway.
In terms of images, there were initially only 5 and they were very well optimised SVGs (just the logos of various pwned companies) which kept them down to a total of 12.1KB. Unfortunately I simply couldn’t get Azure to compress them though, either over HTTP or by saving them as SVGZ (it just didn’t want to serve the mime type despite all the usual attempts to have it recognised).
All unnecessary response headers were turned off. There’s no ASP.NET version or MVC version or powered by header. The only non-essential stuff is an XFO header and a session affinity cookie and server header added by Azure.
The API returns a string array of pwned sites in JSON. The aforementioned affinity cookie is redundant but other than that it’s a very, very tight HTTP chat.
In terms of quantifying the baseline performance, the site got a solid “A” grade result from YSlow and likewise from Web Page Test. Hey, this thing is no slouch! But I think we can do better.
Frankly, all of this is pretty much the starting point for any website regardless of expected scale because it’s easily done and has a great, positive impact on performance. But it wasn’t enough.
Prioritising scale objectives
Let me drill into what I meant earlier on when talking about optimising for speed versus optimising for egress data as whilst there’s a lot of cross over, there are also some key points of difference:
- Speed: This is all about the user experience – how can I get the site loaded as fast as possible so that it’s usable (this is a key word that I’ll come back to a lot).
- Data volume: Here I needed to keep the amount of outbound data on the service I was paying for at an absolute minimum.
Let me give you an example of where these objectives may be mutually exclusive: In order to reduce the number of HTTP connections the browser needed to make, I used ASP.NET bundling and minification features to roll jQuery into the one bundle along with my custom JS and serve it all up in the one request. That’s great, but it meant I was paying to serve jQuery, If I had used a CDN such as Google’s instead, yes, there’d be an extra HTTP request but the data wouldn’t be hitting my account. Of course the counter-argument is that a CDN offers the advantage of reduced latency if it can get the content closer to the browser to begin with. I’ll come back to that.
Defining “usability”
People sometimes get a bit religious about what makes a site “usable” and when a page is actually “loaded” and what times you really should be measuring. Let’s break it down for HIBP and to do that we need to have a look at it:

Clearly the first priority is to actually get the HTML loaded, nothing is going to happen until that comes down. Most of the tuning ability there is what happens on the server side plus obviously using HTTP compression on the way down. Clearly right after that is the CSS – no CSS, no worky. However, that’s all it needs to initially “work” – HTML and CSS. That covers everything you see above except for the Adobe logo. The background gradient? Just a CSS gradient. The large logo in the middle of the page (and the little one in the top left)? Just CSS rounded corners.
As of now, the page is “usable” – you can take in what the site does and you can start typing in an email address. In fact so long as you don’t actually try and search for the address before the JavaScript is loaded, you’re fine. That’s important – the JS can be delayed as it’s not required until the (relatively) time consuming task of entering an email address.
Actually, the JS is also used to pop up a modal if you click on the breached company name above:
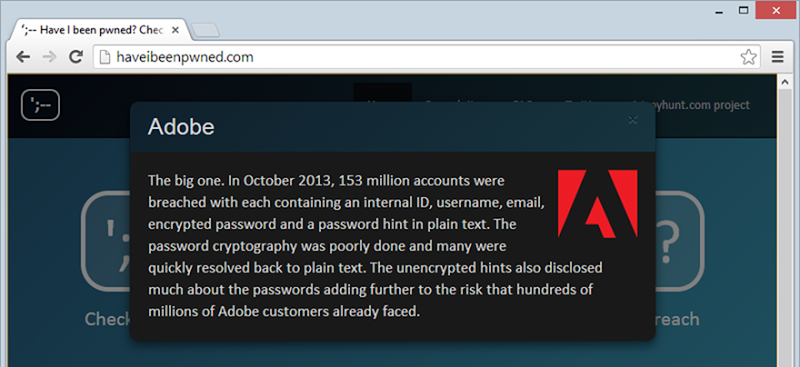
However even in this case, you’ve got the time between the HTML and CSS first loading and the user absorbing what’s going on then deciding to click on the link to actually load the JS and register the click events. In both cases above where the JS is required, if it wasn’t loaded then the page would just fall back to the native HTML constructs of a form post for the search and a hyperlink for the breach details. Ah, the joy of unobtrusive JS!
Also on the usability front, when the HTML first loads, all the breach info that is later displayed of the email has been caught up in a hack loads and is hidden. The following Adobe and Stratfor info is always there along with the other breaches:

It’s inexpensive to plug this into the HTML and it means that as soon as the API comes back with a hit from the search it can just toggle these on in the DOM. Of course that won’t scale vey well – you wouldn’t want to load 100 breaches into the source.
In short, I’m viewing the load lifecycle like this:
Readable –> Visually Complete –> Functionally complete
Each one of those stages is important and only referring to the total load time is simplistic and not accurate – those earlier two stages are very important.
So that’s the flow of the page, now we need to measure.
Measuring all the things
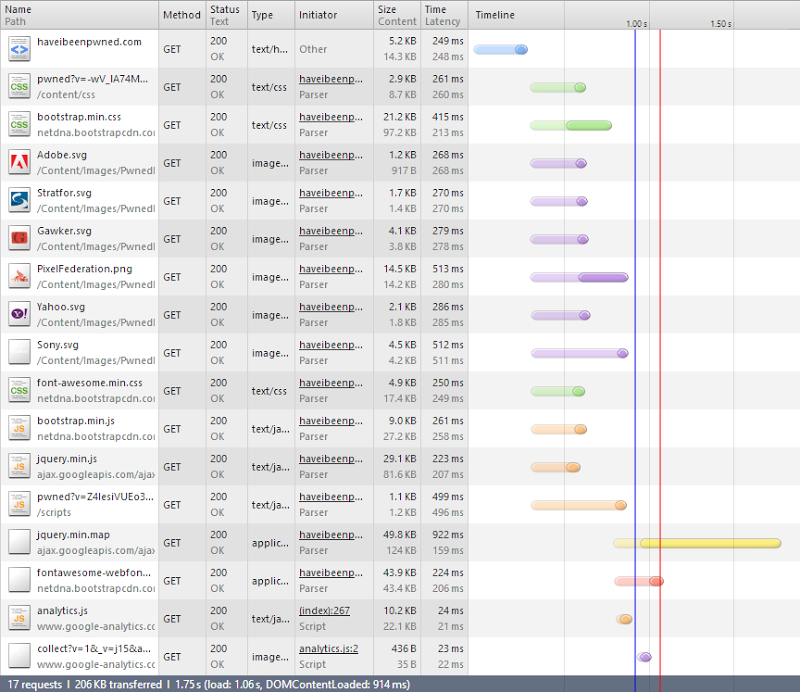
Never, ever optimise without measuring. “Seat of the pants” changes when you’re working at scale (or any time, for that matter) is risky business. So here’s the baseline courtesy of Chrome’s developer tools:
There are three very important things to understand here:
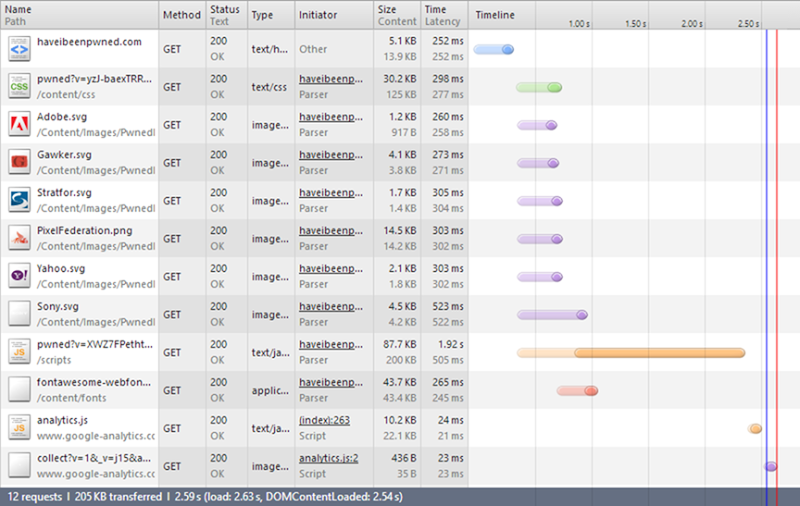
- The “Size” column. In the first two rows you’ll see that the black figure is significantly smaller than the grey one. These are HTTP compressed so the size on the wire is actually a lot less than the size of the actual content. However, all the images beneath that actually have a larger “Size” than they do content because this comprises of both the uncompressed image itself and the HTTP response header.
- The “Time” column. Understanding the duration required for the asset to be pulled down is obviously essentials. The “Latency” value in grey underneath that is the time taken to load the first byte in the response. I’m in Sydney and the site is on the West Coast of the US Azure instance so that has a fundamental impact on the latency and durations for content to load.
- The sequence and staggering of the requests. For example, the first request for the page itself has to load before the other assets can be requested. The CSS has to load before the Font Awesome font can be pulled in. Dependencies between assets and how much can be done asynchronously versus one after the other is important.
The summary at the bottom of the image wraps things up: 12 requests to pull 205KB of data over the wire (not “content” – this is the compressed figure) 2.59 seconds. That time, however, is misleading; to the earlier section on defining usability, we’re really good to go after loading just those first two requests. These are the only ones required to get a good looking page in front of people.
In terms of the data I’m paying for, I’m getting hit with everything other than the two Google Analytics requests right down the bottom which means a total of 194KB.
With that understood, let’s start the tuning.
The effectiveness of serving jQuery via CDN
Keeping in mind that the website performs massively well already from the user perspective, what I really wanted to focus on was bringing down the volume of data I was serving up from Azure. When we look at the stats above, it’s pretty clear where to focus – JavaScript. Four up from the bottom we can clearly see the JS not only having the largest volume sent over the wire at nearly 88KB, but it’s also (unsurprisingly), taking the longest to load. On the latter point, if may just be that the server took a little longer to respond to that request as the bitrate is lower than other requests but regardless of the duration, the size figure remains accurate.
Here’s what I was originally doing:
bundles.Add(new ScriptBundle("~/scripts/pwned").Include(
            "~/Scripts/jquery-{version}.js",
            "~/Scripts/bootstrap.js",
            "~/Scripts/SearchPwnedEmails.js",
            "~/Scripts/PwnedSiteModal.js"));
This is creating a JavaScript bundle which is then minified. In other words, whack everything together so that it becomes one HTTP request then minify it which is why we only see one JS request in the timeline above.
I decided to pull the jQuery piece out of the bundle and instead load it from Google’s CDN:
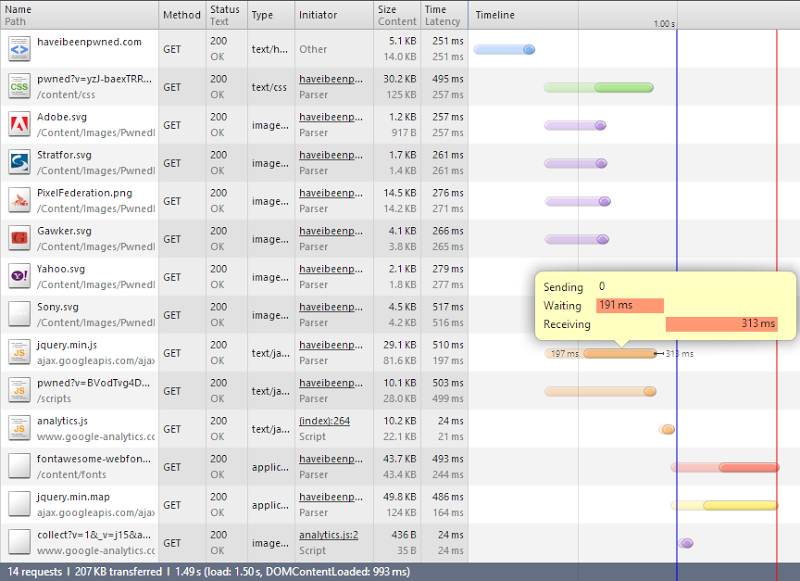
Right, so what have we got here? Firstly, there’s two more requests – the minified jQuery file from the CDN and the JavaScript source map associated with it.
Next thing is that the total bytes transferred has gone from 205KB to 207KB. Seems fair, there’s an extra couple of requests with headers to be processed..
The important bit, however, is that the JS loaded of HIBP has gone from 88KB down to only 10KB. That’s 78KB that I no longer pay for – win! That might not sound like a lot, but it means that for every 100,000 new visitors I save 7.4GB worth of bandwidth.
Saving dollars is good, but there’s another bonus – it’s actually faster. The jQuery off the CDN is loaded in parallel with the JS from HIBP so even though it’s one more request, it happens in async. The other thing is, it’s a lot faster in terms of the bitrate. I’ve hovered over the request so you can see the breakdown of the time taken – much less waiting, much more transferring. In fact although the file is three times the size, the duration is almost identical to the JS served by HIBP (obviously this will differ based on the user’s location). I win on bandwidth charges, the user wins on performance, everyone goes home happy.
There’s one other less readily quantifiable advantage of using a mainstream CDN for jQuery – it might already be cached. The scenario above is faster for the user anyway, but if they’d visited another site that also used the same CDN (and the Google one is a biggie), they may not need to download anything again. You don’t get that by serving your own JS.
Shuffling Bootstrap into a CDN
Looking at the last set of requests above, it’s pretty clear where the next problem is – Font Awesome. There’s nearly 44KB worth of data I’m paying for there so it’s time to apply the same rationale as I did for jQuery. It’s CDN time.
As it turns out, the Bootstrap CDN offers services for Font Awesome, the Bootstrap CSS and the Bootstrap JavaScript. Win, win and win! Let’s shuffle it all over and see how it goes:
Three more requests and actually one less kilobyte. I’m guessing that the byte saving is a combination of response header size and efficiency of the minimisation. I didn’t look into it in detail, but it sounds feasible.
More importantly though, that’s a total of 27KB off the CSS, 9KB off the JS and 44KB off the font. Combine that with the jQuery CDN and I’m saving 158KB – there’s only 36KB left that I’m actually paying for. I just shaved 81% off my bandwidth cost :)
It’s not just the dollar saving though, things are now a whole lot quicker for the user by virtue of lower latency through the CDNs and the browser’s ability to asynchronously hold connections and download data. That’s a bit counterintuitive to the message we’ve been hearing about reducing HTTP requests through bundling, but then again, a CDN offers benefits in other ways.
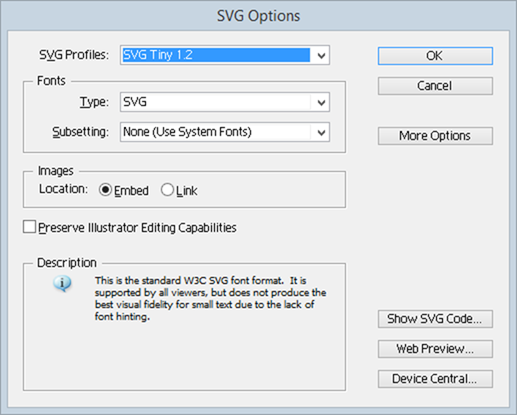
Optimising SVGs
When I originally created the site, I spent a bit of time working through Illustrator’s SVG options. Now I’m admittedly a bit behind in my version (CS3) so there may be better options these days, but I found SVG Tiny 1.2 resulted in the most optimal size:
When I begin this optimisation process, I realised there was a bunch of junk in there that could go. Let me demonstrate by way of a diff on the original and post Troy-optimisation process:
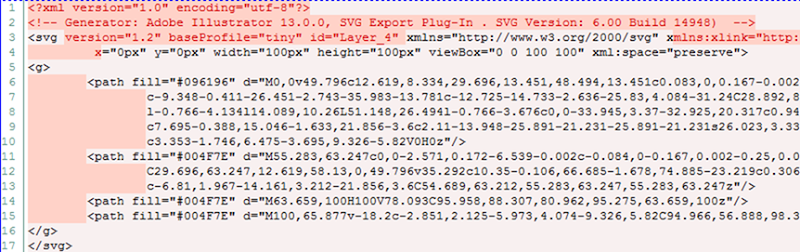
In short, the XML element, Illustrator comments, a bunch of the SVG element attributes and every single white space. Kill those and the Stratfor logo went from 1.38KB to 1.12KB. Ok, it’s only 0.26KB but that’s a 19% reduction and if you apply saving that across 12.1KB of SVGs for, say a million requests and there’s 2.2GB. Plus of course the gain in load time for the user.
So that’s another little gain, but there’s a bigger one to be made with those images.
Using data URIs in CSS (and then rolling them back)
All of this is making good, incremental gains but the one remaining obvious problem is all those requests for the SVGs. Yes, I shaved some size off them in the previous section but it’s still 5 additional requests. They’re also not compressed so we’re really running sub-optimally here.
One of the magical things we can do with images these days is covert them into data URIs. In the case of an SVG, this means just taking the XML out of the file, Base64 encoding it and whacking it into the background property of a class in the CSS:
.adobeLogo
{
  background: url("data:image/svg+xml;base64,PHN2ZyB4bWxucz0...zdmc+") no-repeat center center;
  background-size: 35px 30px;
}
Actually, this is still not perfect; I started out by inserting the original XML after the previously mentioned optimisation and changing the Base64 setting to utf8 and it saved a couple of hundred bytes on each image. It worked fine – in Chrome. Not so much in Firefox or IE.
Then there was the Pixel Federation logo which I hadn’t converted into an SVG. Some logos simply aren’t going to work well in the vector format and a combination of the complexity of this one combined with no readily available vector versions floating around meant keeping it as a PNG made sense (but I will come back to that). I can already sense the “yeah but data URIs can be slow and they’re not great for stuff like this” responses, but it was starting to get nasty having some data URIs in CSS some images both serving the same purpose.
Let’s take a look at where that’s left us:
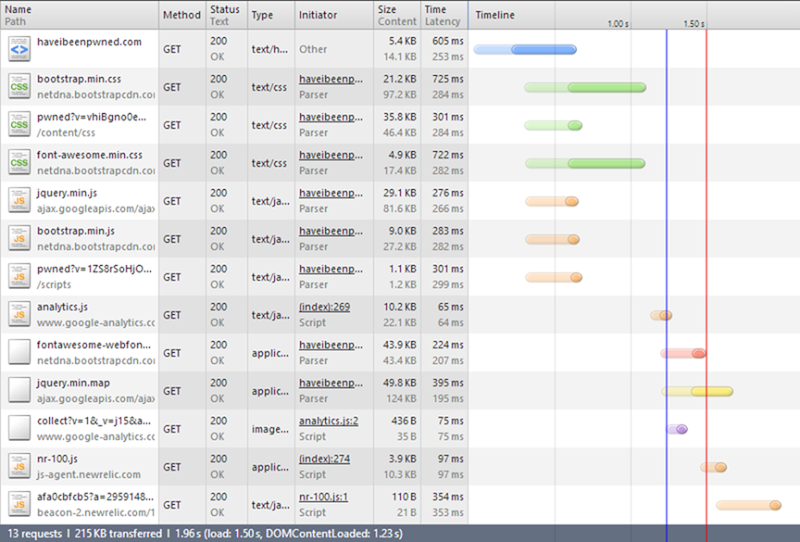
Bit of a mixed result, if I’m honest. Firstly, ignore the last two requests from NewRelic. I added the (totally awesome) service in during the optimisation process. It’s two more requests from their domain totalling 4KB and it’s made after everything else has loaded.
The mixed result in terms of the SVGs is that if you take out the NewRelic data, this is now 211KB where before it was 206. Clearly the bulk is in the CSS – a mere 2.9KB before became 35.8KB after. Of course you’d expect that, after all, we did just kill 28.1KB of images, but the CSS went up 32.9KB! Whilst the data URIs benefited from HTTP compression being in the CSS, they also copped a size penalty in needing to be converted to Base64. Admittedly there were other CSS changes made as well to accommodate the revised structure, but we’re talking a couple of hundred bytes max.
I pushed the change anyway but it literally kept me awake. Firstly, this means that if this sort of thing is affecting my sleep, I’ve probably gone far enough! Secondly, what was getting at me was that the very asset that was required to make the page readable – the CSS – was copping a significant size penalty whilst the gain was being made up on an asset that just wasn’t that important, at least not in the sense that it could load a few milliseconds later. That’s a 12 fold increase in the CSS and for no net bandwidth gain.
The other thing was what would happen when there were 20 pwned data sets in the system? There’ll be a critical mass where I will no longer want all the logos and info on the front page nor will I want to keep indefinitely loading up the CSS with data URIs. It wasn’t going to scale.
Finally, there’s also evidence that data URIs can be a whole heap slower on mobile, apparently up to six times slower. The last thing you want is a degraded experience by trying to save a few bytes.
So I reverted it. Actually I kept the SVGs as background images in the CSS because that made things easier in other ways but they continued to reference SVG files on the file system. So that was that little experiment.
PNG to SVG
The Pixel Federation logo was the one thorn in my side – 14.5KB and tracing that sucker did not look like fun. But what is fun is just uploading it to Vector Magic and having those guys take care of it for you:
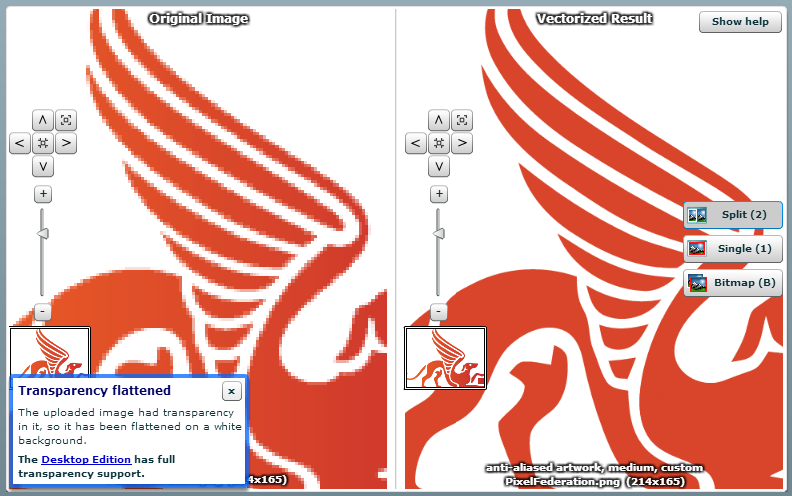
I was sceptical about this, but it actually came up really well. There are a couple of sharp corners on it compared to the original, but it’s more than sufficient for my purposes when it’s only displayed at a fraction of the size you see above. After applying the same SVG tweaks as I described earlier, it came down to only 5.5KB so now I’ve got a full set of highly optimised images and 9KB less for each user to download.
CDN’ing the SVGs (at least that was the plan)
One of many really neat services for checking website performance online is Pingdom. They give you a great report on site performance that looks a little like this:
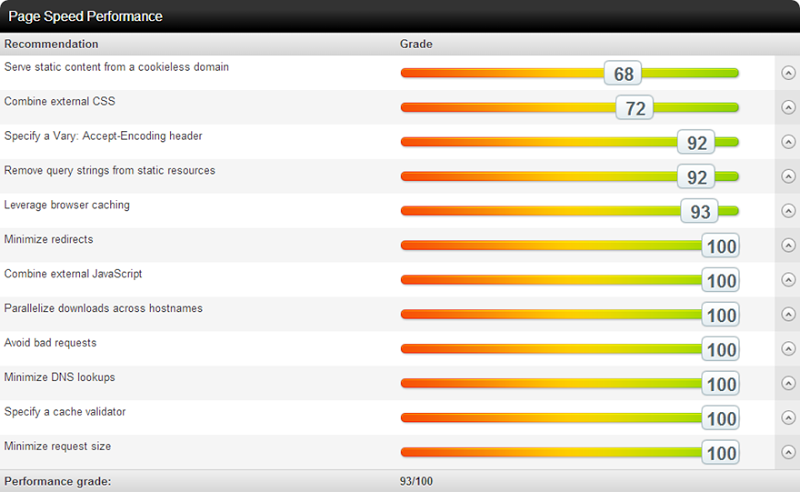
Overall, this is a pretty good result. We can drill into results such as “Leverage browser” caching and get back the details on why the score may be less than optimal:
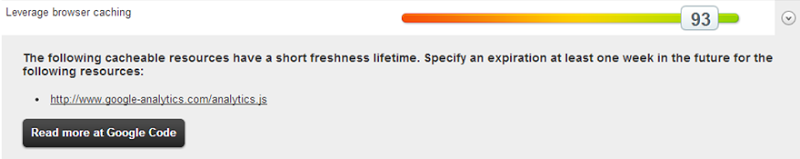
In this case and in the case of query strings from static resources, the Accept-Encoding header and combining external CSS, this is all entirely at the mercy of the external provider. I have absolutely no control, for example, over how Google implements their caching on Analytics. It’s a managed service and that’s about the end of it.
However, I can do something about this one:
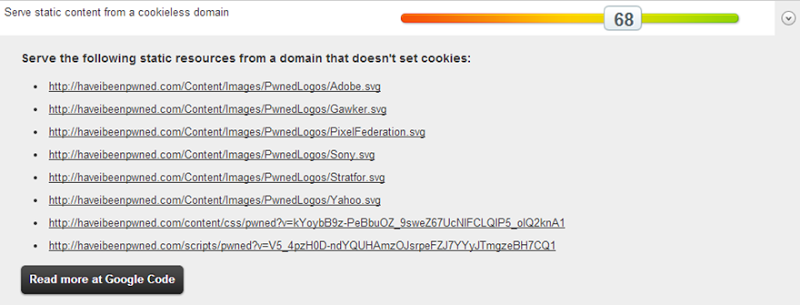
Getting the SVGs closer to the people requesting them will inevitably improve the speed, that goes without saying. It’s also trivial to drop these onto a CDN. However, it’s not trivial to drop the CSS and JavaScript onto a CDN rather than packaging it into the site, at least not if I want to keep my deployment simple and make use of the bundling and minification I’m using in ASP.NET. Let’s just focus on CDN’ing those images and for that we’ll look to the Azure CDN.
Now you don’t get CDN for free, and indeed there is a cost that’s $0.12 per GB for zone 1 (North America and US) and $0.19 for zone 2 (everywhere else). Having said that, non-CDN content is the same price (at least while you’re south of 10TB), the difference is that you get the first 5GB per month for free but given HIBP is smashing through that with HTML, CSS and JS alone, it really won’t make a difference.
So that sounds awesome except… I can’t do it. Well actually I can do it, but Azure can’t. It turns out that the service is currently in hiatus for new subscribers and because I didn’t have a case to use it until now, I can’t get it. Believe me, I tried – I hit up the Azure team directly and I hit up Scott Hanselman in Sydney last night when he presented to a local user group. By all accounts, we’ll see it return next year but that doesn’t do much for me now.
Of course I could use another CDN, I even started going down the CloudFlare path but pragmatism got the better of me: 9KB of images loaded after the most important bits are already there is just not worth the effort.
Client side email validation
One of the things I noticed once NewRelic was dropped in was that I was getting a bunch of errors on the server:
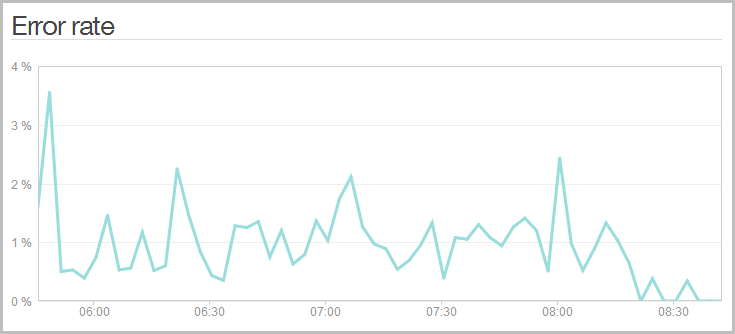
Wait – my site has errors?! I don’t think so! Here’s what was going on:
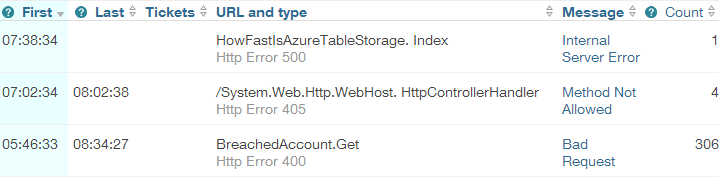
Ah, now it makes sense. Because I was being all HTTP semantic and returning an HTTP 400 when someone entered a screwy email address (i.e. the request is bad if you can’t provide a good email), NewRelic was reporting on this as a bad request and aggregating it into the error reporting. You see I wasn’t using JS at all for email validation and indeed as I’ve written before, email validation is a nightmare. I was just doing a simple “you need at least one @ symbol with stuff either side” validation and because it was so fast, I left it in the API alone.
Of course a more efficient means for all involved is to implement it in JavaScript. No need for the likes of jQuery validation and more libraries, this was a simple vanilla JS implementation. No surprises then what it did to the error log (The spike back up at the end of the day was after I released the API and inevitably some galah is hitting it with bad addresses):
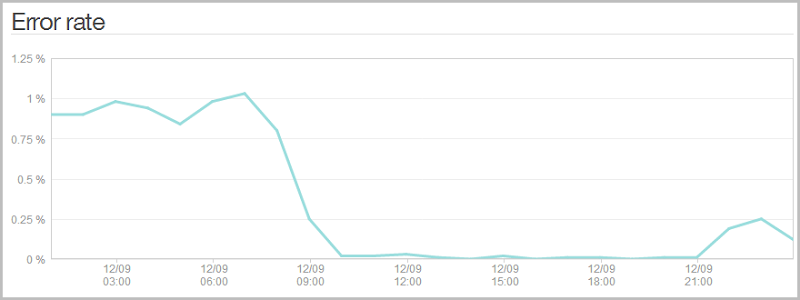
It really doesn’t impact the client experience because the API is so fast anyway, but it does save a few outgoing bytes in the header and keeps things cleaner in the NewRelic logs. Plus of course if the load gets really serious later on, that’s a bunch of requests that won’t be getting served. Of course the server side validation is still there, but it won’t be required under normal operating conditions.
Removing the server header
Well and truly into the micro optimisations now, one response header I did still have but didn’t need was the “server” header. As I’ve written before, you really don’t want to leak these anyway and fortunately it’s easy enough to nuke in Azure. So there’s a couple dozen more bytes saved plus it keeps ASafaWeb happy:
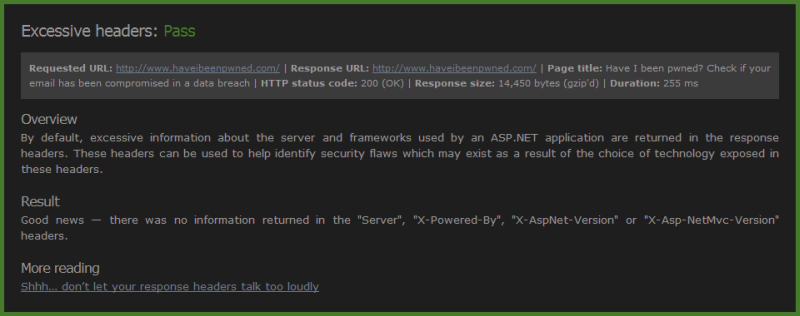
Once your optimisations are getting down to the level of removing server headers, you’re probably past the best use of your time I think that’ll do it!
Summary
This was a fast site to begin with – lightening fast – but here’s what I’ve been able to achieve via optimisations:
- 158KB per non-cached visit saved by moving stuff to CDNs (81% reduction in bandwidth use)
- The same amount again now pulled from geo-convenient locations for the user (speedier for them)
- 10.5KB saved though SVG optimisation and PNG conversion
- Hundreds of requests per day saved from the server by validating on the client
tl;dr – users are downloading 13KB less and from closer locations, I’m paying about $40 per month less for bandwidth based on current traffic and Azure’s pricing (168.5KB x 2M = 321GB) plus the whole thing runs a lot faster for the end user. Everybody goes home a winner!