
This is not what you want to see on your Azure website:
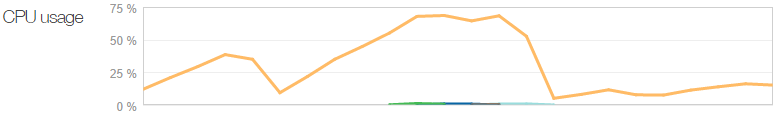
Ok, so what are we looking at here? CPU goes up and up and up and then… dramatically down. There are even some additional coloured lines in the middle of that graph indicating that there were more instances put on just to deal with the load. So it must have been some pretty serious load, right? Not so much:
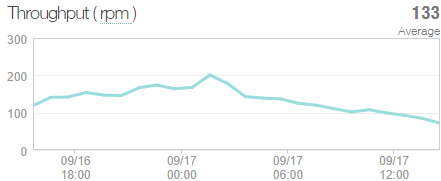
Huh, only a couple of requests a second. Clearly I’ve broken it.
It’s easy to jump to this conclusion and that’s exactly what I did, but I was wrong. It all started when I had some fairly serious visitor numbers drop by “Have I been pwned?” (HIBP) the other day. Actually, it was after this I noticed the above oddity; the CPU kept ramping up disproportionately to the request volume. In fact the request volume could be flat at very low numbers yet the CPU would spiral out of control. I’d restart the app and it would all come good. Something in the code wasn’t playing nice.
So I started ripping bits out – suspicious bits – things I’d changed since I believed it was last running well, stuff like additional logging. Clearly I’d screwed up something and if I pulled out enough bits it would eventually come good, right?
By pure coincidence, I logged a ticket with NewRelic on an unrelated matter and mentioned the behaviour.
“Oh, you’re running the latest version 3.6.177.0? Yeah, that one kinda has a bug, try rolling back to 3.4.24.0”
Alrighty then, uh, thanks? To be fair, NewRelic handled this as well as they possibly could when consuming humble pie. We all appreciate that the very nature of software is that it can be a complex beast, especially when you’re doing the sorts of complex things NewRelic is. The bottom line, however, is that since late August I’d been taking a big hit on CPU perf.
Anyway, fix in and here’s what I saw over a 24 hour period including a good whack of load courtesy to someone hammering the API:
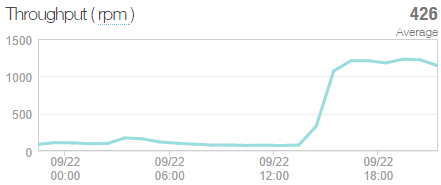
That’s a sustained 1.2k requests per minute towards the end of the graph, a healthy load for the site. So what does the CPU do now? Let’s take a look:
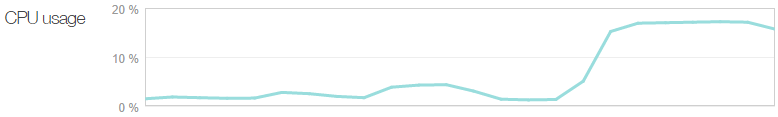
That’s 17% at the peak. That is all. So rather than the earlier graph where the CPU was getting towards 75% with only a couple of hundred requests per minute, now we’re looking at six times the volume with only one quarter the CPU utilisation. You could argue that compared to peak utilisation with the buggy NewRelic version, the site is now 24 times more efficient. Whoa.
Whilst I’m overjoyed to have this resolved without me going through what I was expecting to be a very painful troubleshooting process, it does unfortunately call into question all the scale figures I observed. Bugger. Of course all the information around thresholds for scaling and instance sizes and how I could still deploy the app on demand and so on are all still perfectly valid, it’s just the CPU usage and consequently the infrastructure demands were way too high.
But it also raises some other interesting issues which are worth noting here:
- In an era of increasing dependency on third party libraries, you can do everything right and still be wrong. The library in question was released on Aug 27, I deployed it on Aug 28 and it was three and a half weeks later before I realised it had issues.
- In a modern cloud environment, you could pay for other peoples’ mistakes! The increased CPU almost certainly caused Azure to scale out earlier than it should and me to scale it up when it probably wouldn’t have needed to with the non-buggy library. This costs money.
- I should have established a baseline of infrastructure performance against load. The graphs above are a perfect example – if I see CPU above single digits when it’s only servicing 500 requests a minute, I should know that something is wrong.
- Following the previous point, you need to be looking for anomalies in performance after a release. I should have picked this up well before the big load hit and I didn’t. I’m trying to recall, but I suspect I got some CPU utilisation warnings from Azure which resolved themselves (possible after a code release that restarted the app) and I just never looked into it.
I’m choosing to write about these experiences with HIBP and Azure in a pretty “warts and all” fashion in the hope it helps others see the sorts of things you go through in a modern day cloud app of this nature. Sometimes that means demonstrating my own oversights or things I just got blatantly wrong but hey, that’s software development and it would be wrong to only paint a glossy picture of it!