
This is the traffic pattern that cloud pundits the world over sell the value proposition of elastic scale on:
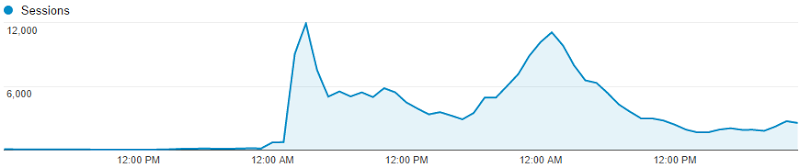
This is Have I been pwned? (HIBP) going from a fairly constant ~100 sessions an hour to… 12,000 an hour. Almost immediately.
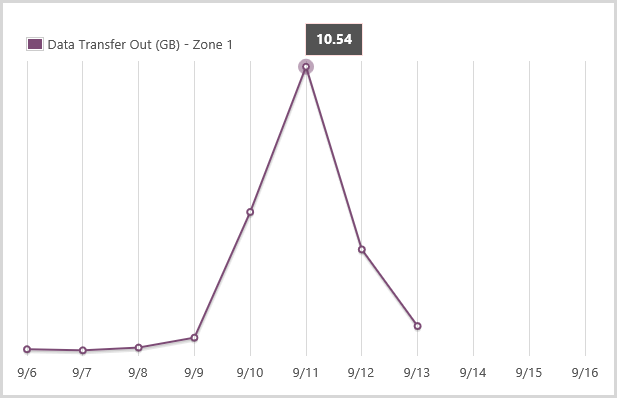
This is what happened last week when traffic literally increased 60-fold overnight. September 10 – 2,105 sessions. September 11 – 124,036 sessions. Interesting stuff happens when scale changes that dramatically, that quickly so I thought I’d share a few things I learned here, both things I was already doing well and things I had to improve as a result of the experience.
Oh – why did the traffic go so nuts? Because the news headlines said there were 5 million Gmail accounts hacked. Of course what they really meant was that 5 million email addresses of unknown origin but mostly on the gmail.com domain were dumped to a Russian forum along with corresponding passwords. But let’s not let that get in the way of freaking people out around the world and having them descend on HIBP to see if they were among the unlucky ones and in the process, giving me some rather unique challenges to solve. Let me walk you through the important bits.
1) Measure everything early
You know that whole thing about not being able to improve what you can’t measure? Yeah, well it’s also very hard to know what’s going on when you can’t empirically measure your things. There were three really important tools that helped greatly in this exercise:
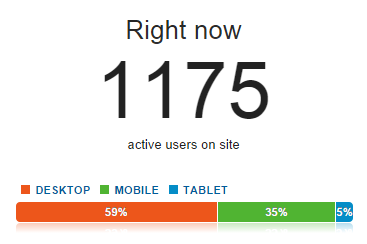
Google Analytics: That’s the source of the graph above and I used it extensively whilst things were nuts, particularly the real time view which showed me how many people were on the site (at least those that weren’t blocking trackers):
New Relic: This totally rocks and if you’re not using on your Azure website already, go and read Hanselman’s post about how to get it for free.
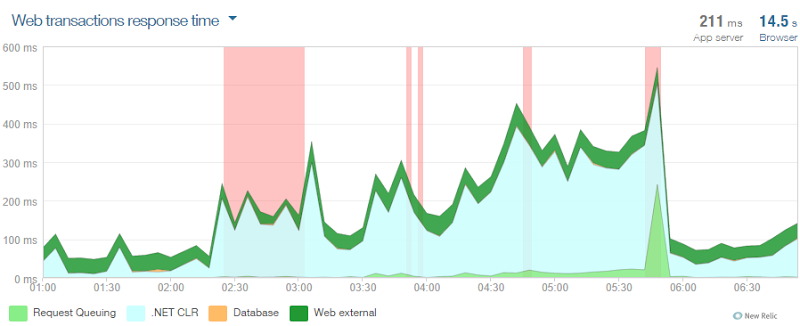
In fact this was the first really useful tool for realising that not only did I have some serious load, but that it was causing a slowdown on the system. I captured the graph above just after I’d sorted the scaling out – it shows you lots of errors from about 2:30am plus the .NET CLR time really ramping up. You can see things improve massively just before 6am.
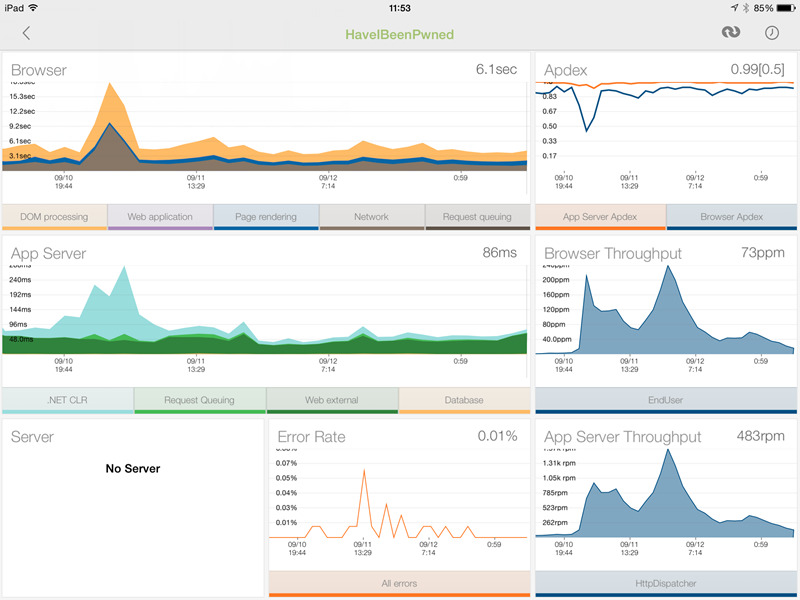
NewRelic was also the go-to tool anytime, anywhere; the iPad app totally rocks with the dashboard telling me everything from the total requests to just the page requests (the main difference being API hits). The particularly useful bits were the browser and server timings with the former including things like network latency and DOM rendering (NewRelic adds some client script that does this) and the latter telling me how hard the app was working on the server:
Azure Monitoring: You also get this for free and it’s part of the Azure Management Portal. This includes metrics on the sort of stuff you’re going to get charged for (such as data out) so it’s worth watching:
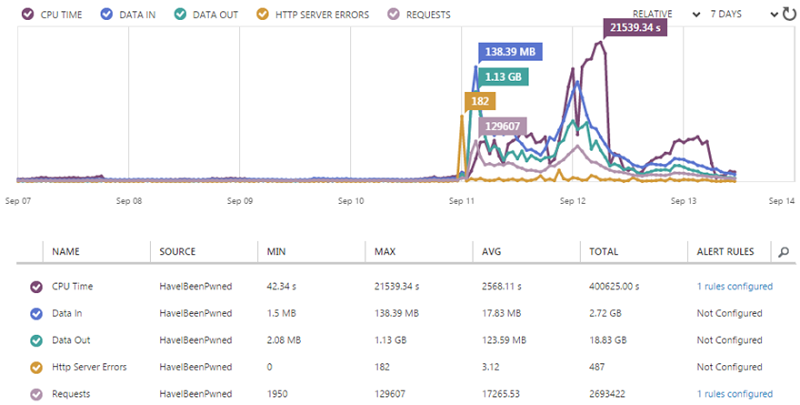
It also ties in to alerts which I’ll cover in a moment.
The point of all this is that right from the get-go I had really good metrics on what was going on and what a normal state looked like. I wasn’t scrambling to fit these on and figure out what the hell was going on, I knew at a glance because it was all right there in front of me already.
2) Configure alerts
I only knew there were dramas on Thursday morning because my inbox had been flooded with alerts – I had dozens of them and they looked like this:
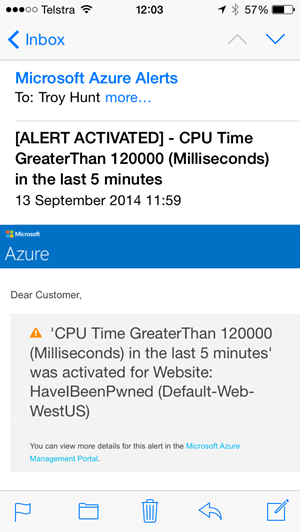
This is an Azure alert for CPU time and I also have one for when total requests go above a certain threshold. They’re all configuration from the monitoring screen I showed earlier and they let me know as soon as anything unusual is going on.
The other ones that were really useful were the NewRelic ones, in particular when there was a total outage (it regularly pings an endpoint on the site which also tests database and table storage connectivity) but also when the “Apdex” I mentioned earlier degrades:
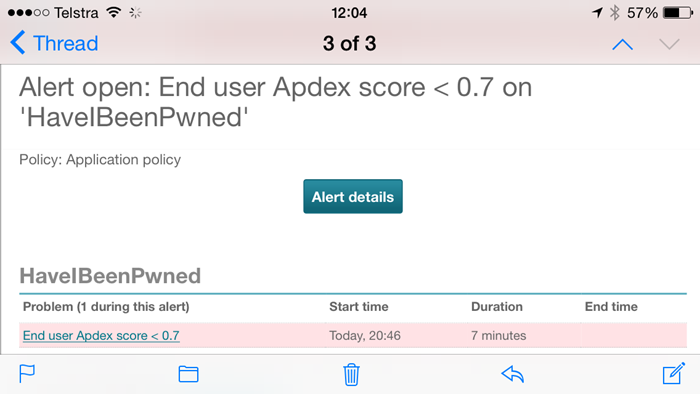
The Apdex is NewRelic’s way of measuring user satisfaction and what’s great about it is that it cuts through all the cruft around DB execution times and request queuing and CLR time and simply says “Is the user going to be satisfied with this response?” This is the real user too – the guy loading it over a crappy connection on the other side of the world as well as the bloke on 4G next to the data centre. I’m going off on a bit of a tangent here, but this is what happened to the Apdex over the three days up until the time of writing on Saturday morning:
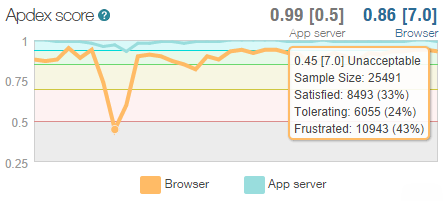
At its lowest point, over 25k people were sampled and way too many of them would have had a “Frustrating” experience because the system was just too slow. It loaded – but it was too slow. Anyway, the point is that in terms of alerts, this is the sort of thing I’m very happy to be proactively notified about.
But of course all of this is leading to the inevitable question – why did the system slow down? Don’t I have “cloud scale”? Didn’t I make a song and dance recently about just how far Azure could scale? Yep, but I had one little problem…
3) Max out the instance count from the beginning
If the concept of scaling out is foreign or indeed you’re not familiar with how it’s done in Azure, read that last link above first. In a nutshell, it’s all about adding more of the same resource rather than increasing the size of the resource. In Azure, it means I can do stuff like this:
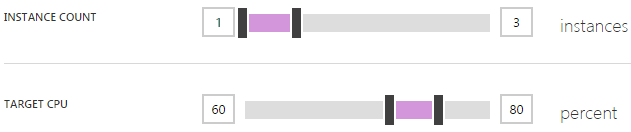
You see the problem? Yeah, I left the instance count maxing out at 3. That is all. That is what caused my Apdex to become unacceptable as Azure did exactly what I told it to do. This, in retrospect, was stupid; it’s there as a control to limit your spend so that you don’t scale up to 10 instances then a month later when your bill arrives, get a big shock, but if you’ve got alerts, it’s kinda pointless. Let me explain:
Azure charges by the minute. Spin up an instance, use it for an hour and a half, turn it off and you’ll only pay for 90 minutes worth of usage. Regardless of the size of the instance, 90 minutes is going to cost what for all intents and purposes is zero dollars. If you have alerts configured such as ones for unusually high requests (which you can do via the Azure Management Portal), you’ll know about the environments scaling up very soon after it happens, possibly even before it happens depending on how you’ve configured them. With the benefit of hindsight, I would have far preferred to wake up to a happy website running 10 instances and charging me a few more dollars than one in pain and serving up a sub-par end user experience.
Of course the other way of looking at this is why on earth would you ever not want to scale? I mean it’s not like you say, “Wow, my site is presently wildly successful, I think I’ll just let the users suffer a bit though”. Some people are probably worried about the impact of something like a DDoS attack but that’s the sort of thing you can establish pretty quickly using the monitoring tools discussed above.
So max out your upper instance limit, set your alerts and stop worrying (I’ll talk more about the money side a bit later on).
4) Scale up early
Scaling out (adding instances) can happen automatically but scaling up (making them bigger) is a manual process. They both give you more capacity but the two approaches do it in different ways. In that Azure blog post on scale, I found that going from a small instance to a medium instance effectively doubled both cost and performance. Going from medium to large doubled it again and clearly the larger the instance, the further you can stretch it.
When I realised what I’d done in terms of the low instance count cap, I not only turned it all the way up to 10, I changed the instance size from small to medium. Why? In part because I wasn’t sure if 10 small instances would be enough, but I also just wanted to throw some heavy duty resources at it ASAP and get things back to normal
The other thing is that a larger instance size wouldn’t get swamped as quickly. Check this graph:
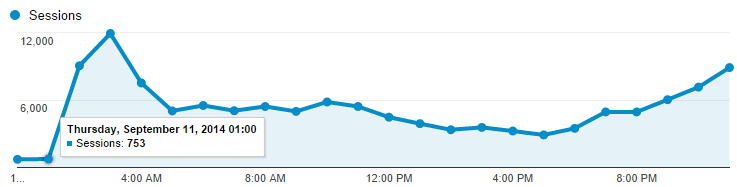
That’s 727 sessions at midnight, 753 at 1am then 9,042 at 2 and 11,910 at 3am. That’s a massive change in a very small amount of time. Go back to that perf blog again for the details, but when Azure scales it adds an instance, sees how things go for a while (a configurable while) then adds another one if required. The “cool down” period between adding instances was set at 45 minutes which would give Azure heaps of time to see how things were performing after adding an instance and then deciding if another one was required. With traffic ramping up that quickly, an additional small instance could be overwhelmed very quickly, well before the cool down period had passed. A medium instance would give it much more breathing space.
Of course a large instance would give it even more breathing space. As it happened, our 2 year old woke up crying at 1am on Friday and my wife went to check on her. The worried father that I was, I decided to check on HIBP and saw is serving about 2.2k requests per minute with 4 medium instances. I scaled up again to large and went back to bed – more insurance, if you like. (And yes, the human baby was fine!)
5) Azure is amazingly resilient
Clearly the HIBP website got thoroughly hammered, there’s no doubt about that. What tends to happen when a site gets overwhelmed is that stuff starts going wrong. Obviously one of those “going wrong” things is that it begins to slow down and indeed the Apdex I showed earlier reflects this. Another thing that happens is that the site crumbles under the load and starts throwing errors of various types, many of which NewRelic can pick up on. Here’s what it found:
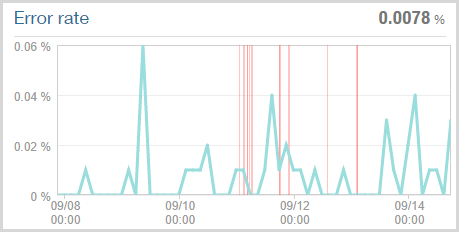
The key figure is in the top right corner – 0.0078% error rate or in other words, that’s 1 in every 128,000 requests that resulted in an error over the week preceding the time of writing. Now of course that’s only based on the requests that the site could actually process at all and consequently NewRelic could monitor. Those red lines are when HIBP was deemed to be “down” (NewRelic remotely connects to it and checks that it’s up). Having said that, I’ve seen NewRelic report the site as being “offline” before and then been able to hit it via the browser no problems during the middle of the outage anyway. The ping function it hits on the site shows a fairly constant 2.66 requests per minute so of course it’s entirely possible it was up within a reported outage (or down within a reported uptime!):

Inevitably there would have been some gateway timeouts when the site was absolutely inundated and hadn’t yet scaled, but the fact that it continued to perform so well even under those conditions is impressive.
6) Get lean early
There’s a little magic trick I’ll share with you about scale – faster websites scale better. I know, a revelation isn’t it?! :)
Back in December I wrote about Micro optimising web content for unexpected, wild success. As impressive as the sudden popularity was back then, its paled in comparison to last week but what it did was forced me to really optimise the site for when it went nuts again, which it obviously did. Let me show you what I mean; here’s the site as it stands today:
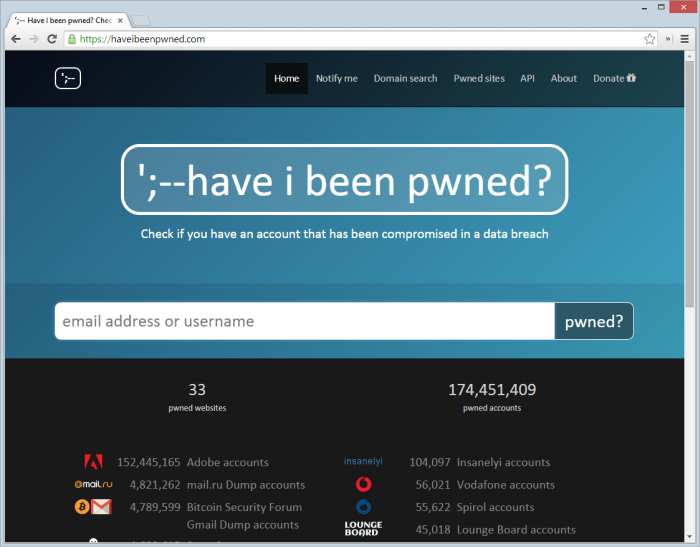
Keeping in mind the objective is to scale this particular website as far as possible, let’s look at all the requests that go to haveibeenpwned.com in order to load it:
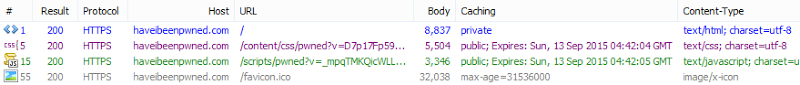
Wait – what?! Yep, four requests is all. The reason the requests to that specific site are low is threefold:
- I use public CDNs for everything I can. I’m going to come back and talk about this in the next point as a discrete item because it’s worth spending some time on.
- I use the Azure CDN service for all the icons of the pwned companies. This gets them off the site doing the processing and distributes them around the world. The main complaint I have here is that I need to manually put them in the blob storage container the CDN is attached to when what I’d really like is just to be able to point the CDN endpoint at the images path. But regardless, a minute or two when each new dump is loaded and it’s sorted. Update: A few days after I posted this, support for pointing the CDN to a website was launched. Thanks guys!
- All the JavaScript and CSS is bundled and minified. Good for end users who make less HTTP requests that are smaller in nature and good for the website that has to pump down fewer bytes over fewer requests. It’d be nice to tie this into the CDN service too and whilst I could manually copy it over, the ease of simply editing code and pushing it up then letting ASP.NET do its thing is more important given how regularly I change things.
But of course this can be improved even further. Firstly, 32KB is a lot for a favicon – that’s twice the size of all the other content served from that domain combined! Turns out I made it 64px square which is more than enough and that ideally is should be more like 48px square. So I changed it and shaved off half the size then I put that in the CDN too and added a link tag to the head of my template. There’s another request and 32KB gone for every client that loads the site and looks for a favicon. That’ll go live the next time I push the code.
Another thing that kept the site very lean was that there is almost no real processing to load that front page; it’s just a controller returning a view. It does, however, use a list of breaches from a SQL Azure database, but here’s what the throughput of that looked like:
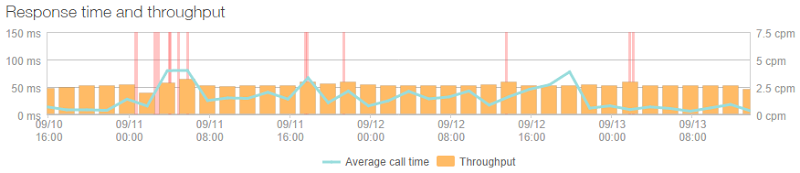
Huh – it’s almost linear. Yep, because it’s cached and only actually loaded from the database once every five minutes by the home page (it’s also hit by the ping service to check DB connectivity is up hence the ~2.5cpm rate in the graph). That rate changes a little bit here and there as instances change and it needs to be pulled into the memory of another machine, but it has effectively no effect on the performance of the busiest page. It also means that the DB is significantly isolated from high load, in fact the busiest query is the one that checks to see if someone subscribing to notifications already exists in the database and it looked like this at its peak:
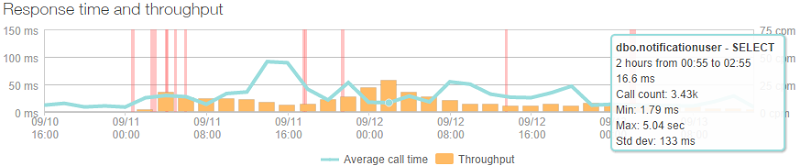
That’s only 3.43k calls over two hours or a lazy one call every two seconds. Of course it’s fortunate that this is the sort of site that doesn't need to frequently hit a DB and that makes all the different when the load really ramps up as database connections are the sort of thing that can quickly put a dent in your response times.
So if I’m not frequently hitting a DB, what am I checking potentially pwned accounts against? It’s all explained in detail in my post on Working with 154 million records on Azure Table Storage – the story of “Have I been pwned?” but in short, well, that heading kind of gives it away anyway – it’s Azure Table Storage. As that blog posts explains, this is massively fast when you just want to look up a row via a key and with the way I’ve structured HIBP, that key is simply the email address. It means my Table Storage stats looked like this:
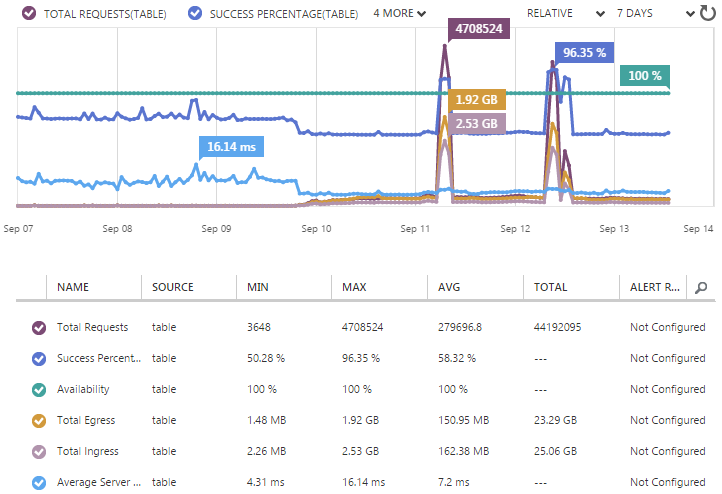
Now this is weird because it has two huge peaks. These are due to me loading in 5M Gmail accounts on Thursday morning then another 5M mail.ru and 1M Yandex the following day. As busy as the website got over that time, it doesn’t even rate a mention compared to the throughput of loading in 11M breached records.
But we can still see some very useful stats in the lead-up to that, for example the average server latency was sitting at 7ms. Seven milliseconds! In fact even during those big loads it remained pretty constant and much closer to 4ms. The only thing you can really see changing is the success percentage and the simple reason for this is that when someone searches for an email account and gets no result, it’s a “failed” request. Of course that’s by design and it means that when instead of organically searching for email addresses which gets a hit about half the time, the system is actually inserting new rows therefore the “success” rate goes right up.
Wrapping up this section though, what I’m getting to is that the site was extremely efficient to begin with and because of that I got a lot more scale out of it than I would have otherwise. I can’t overstate the importance of this enough; optimisations are absolutely critical for growth and of course they make the thing a whole lot nicer to use even during normal usage patterns. Optimise early, before you actually have to.
7) Steal other peoples’ bandwidth now!
Right, so to the earlier point above about using public CDNs, I’m using these for everything I possibly can. That includes jQuery, Bootstrap (CSS and JS) and Font Awesome. It looks like this:
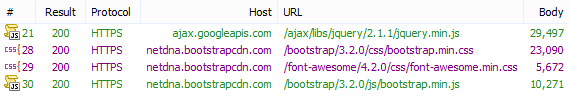
This is a great thing perf wise for a few reasons. Firstly, it saved HIBP from having to deal with four additional requests and 69KB for every new visitor that came by thus freeing it up to focus on other things. Ok, I would have bundled this in with the other JS and CSS on the site so the requests would be the same, but the bandwidth usage would be roughly the same which brings me to the next point: I didn’t have to pay for the data. Multiple that 69kb out by about a quarter million visitors over the busy period and we’re talking about 16GB of bandwidth I didn’t need to pay for.
The final point though is simply speed. So much of this exercise has been about getting that Apdex down and that includes everything it takes to make the page work for people. The public CDNs not only put the data in locations that are closer to those requesting it, because they’re big and popular (certainly the Google jQuery one is), there’ll be a certain portion of people that have previously loaded it from another site and already have it cached in their browser. You don’t get faster than pulling directly from local cache!
Actually, while we’re talking geography here, one thing that will inevitably be asked is why I don’t use Azure’s Traffic Manager and distribute the site out to various Azure data centres around the world. I could very easily do that (as Scott explains in that link) and I may well do so in the future, but at the moment the site still runs happily on a single instance the vast majority of the time. Putting another node in, say Europe, would literally double my website costs. Mind you, if ever it gets to a constant load where a single instance isn’t enough, that’ll be about the smartest thing to do as it’ll deal with the increased scale in a way that not only makes it much faster for those in the second location, but also literally doubles my ability to scale under serious load due to having a second data centre at my disposal.
8) Always, always be ready to release at the drop of a hat
Dealing with demand that ramps up this quickly and this unexpectedly requires you to be able to react quickly. One of the things I decided to do very early on is remove a piece of code I’d dropped in only a few days earlier. It was intended to spin off another thread and send an “event” to Google Analytics to log an API hit, something I was previously only tracking via the client side (the web page would miss people directly calling the API). I just wasn’t confident enough that all those outbound requests to Google Analytics via the server wasn’t having an adverse impact on the perf, so I killed it.
Here’s the point though: because the code was in a state where it was ready for release (I would building another feature out in a separate Git branch), all I had to do was make the change, push it up to GitHub then wait for the magic to happen:
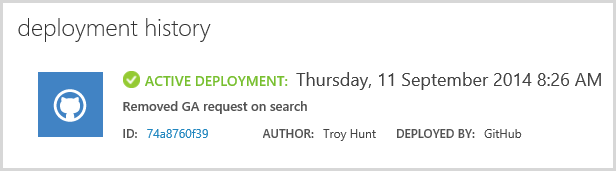
This is a really low friction process too. There’s a little disruption on response time (I often see NewRelic saying things ran slower for a fraction of a minute), but it’s an easy, easy fix and it doesn’t impact people using the site in any tangible way. The point is that I could make changes and get them live at will. Had the demand kept escalating, I had other ideas on how I could reduce the load via code and the only barrier would be my ability to actually make the changes, never that I couldn’t get it live quickly and without impacting an environment under heavy load.
Of course part of the ability to release quickly is also down to the fact that I have build automation. About four years ago I wrote the You’re deploying it wrong! series and really harped on the value of automation. These days I cringe when I see people deploying websites on an ongoing basis by building it in Visual Studio or god forbid, FTP’ing partial pieces of the solution. There are so many reasons using tools like GitHub and Azure’s Kudu service to push the code up makes sense. Just do it and never look back!
9) Experiment with instance size and auto scale parameters to find your happy place
One of the things I found with this exercise that pleased me enormously is that the scaling up and down and out (and in?) process had no impact on performance of any note during the transition. I wasn’t sure when, say, scaling up to a larger instance size if it might result in failed requests as the logical infrastructure rolled over. Some graphs might have shown a small spike, but I saw no dropped requests or anything else to suggest that users were getting an unacceptable experience.
By Friday night things had started to taper off a bit and whilst I still kept the instance size at “medium”, it had dropped down to only one instance. Then two. Then one. Then two. Then, well, it looked like this (each colour is a different logical machine):
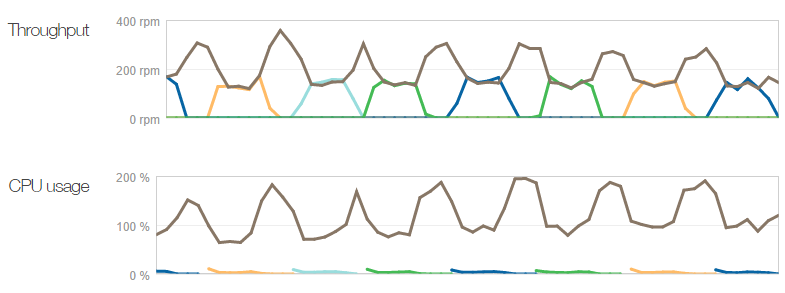
It was yo-yo’ing. Two instances got the average CPU down beneath the threshold required to take an instance away, but one kept it above the threshold required to add another one. This was not a “happy place” and indeed every time it dropped back to one, NewRelic would report the browser Apdex dropping off a bit. Clearly my lower bound for the CPU range was too high and I needed to have it really cruising before taking an instance away so that I could be confident that halving the compute power wasn’t going to cause problems.
And there’s your other issue; when you drop from two to one instance, that’s 50% of your scale gone. That’s a big jump in one go and all things being equal, suggests that four small instances rather than two medium ones gives you a lot more tunability. Regardless, I scaled up the minimum instance range to two so I could sleep without stressing over it. The biggest change that would happen overnight now was a one third drop from three to two which is somewhat more palatable than losing half your horsepower.
Even come Sunday morning, things were still jumping around between one and two instances. I’d been doing a bunch of tweaking with the scale thresholds and clearly I’d left it in a bit of an unstable state. Mind you, the Apdex was now acceptable so users were happy, but there was no need to have instances coming and going so frequently.
Ultimately, I set it back to the defaults which means these conditions for adding an instance:
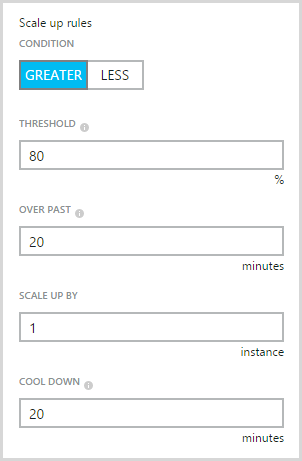
And these ones for taking an instance away:
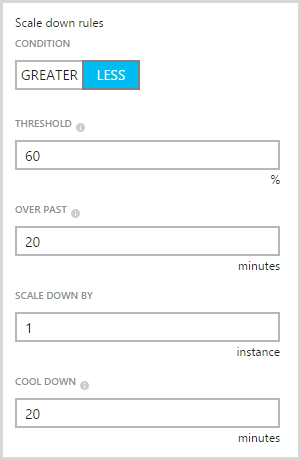
As soon as I did that, everything settled down. Apdex was fine, instance count stayed stable on just one machine, everyone was happy.
What I will say though is that clearly, every app is different. There are different triggers that indicate changes in load that will likely require changes in scale and different points at which that should happen. You’re constantly trading off not wanting things to get slow in the first place versus not wanting costs to go up unnecessarily. Load testing will only tell you so much about this too; yes the previous tests I’d done were consciously focused on a very narrow aspect of performance (just the API) and there are some much more sophisticated approaches to replicating real-world user behaviour, but nothing tests a system like real world, non-fabricated, good old fashioned popularity!
10) Relax, it’s only money!
And now the question that so many people asked after all the dust had settled – how much did it cost me? All this scale ain’t cheap, right? Let’s break it down courtesy of Azure’s billing portal.
Firstly, here’s how the scale fluctuated over the full period of craziness:

One minor frustration is that there’s not really a single good visualisation of load and instances over time in either the “classic” portal or Microsoft’s new shiny one (which this one is from). Regardless, what it does show is a lot of scaling up and down which we kinda knew anyway, but it’s the cost side of it I’m most interested in now. (Incidentally, I’m seeing some oddness in CPU utilisation even after all the load has gone, something I’m yet to get to the bottom of.)
I used three types of resources in ways I wouldn’t usually do under normal circumstances. The first is “small” standard websites hours. Normally it’s simple – I leave it on all day and there’s a single instance so I pay for 24 hours a day. You can see it running a steady pace for the first few days in the graph below:
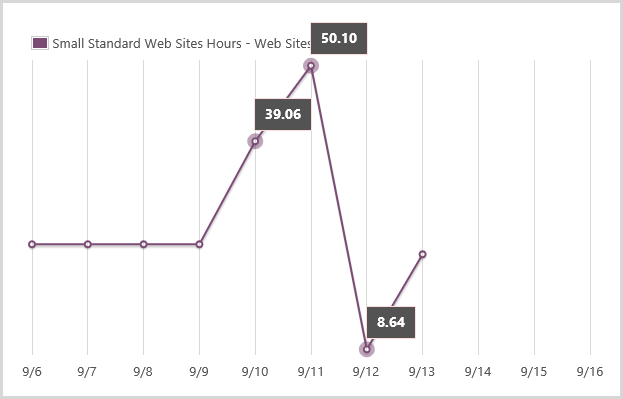
It jumps up on the 10th, again on the 11th then the 12th is actually quite low. By then I was running on mostly medium instances so the cost moves to another tier. Main thing from the graph above is that I consumed 25.80 hours of small standard website I wouldn’t normally have used. Obviously the numbers that exceed 24 hours in one day are due to having multiple simultaneous instances running.
Onto the medium scale. I normally wouldn’t run any medium instances and it was just the 11th and 12th where I’d manually scaled up and consumed hours:
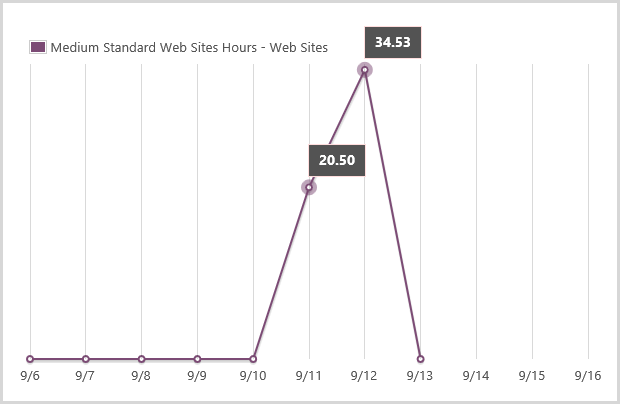
All the hours here can be attributed to the additional load so there’s 55.03 medium instances hours right there.
Onto the big guy and this is the one I scaled up at 1am on the 11th because I was paranoid then scaled back to medium after I got up later that morning:
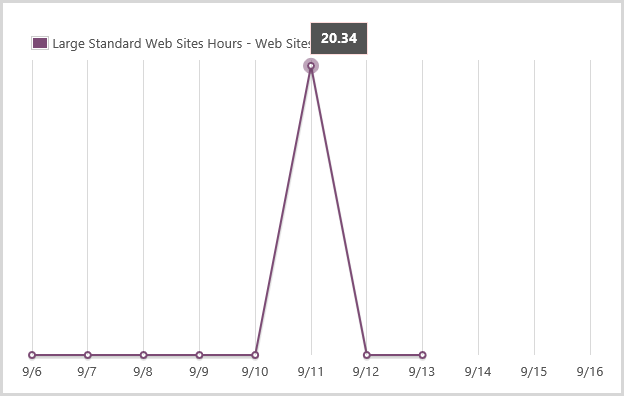
It actually ran multiple large instances at once and quite clearly chewed up 20.34 hours over about a 7 hour period. Oh – incidentally, Azure bills down to a very fine grain so those 20.34 hours actually appear on the bill as 20.34083 hours.
Let’s add it all up and work out some costs:
| Instance size | Cost per hour | Extra hours consumed | Total cost |
| Small | $0.10 | 25.08 | $2.51 |
| Medium | $0.20 | 55.03 | $11.01 |
| Large | $0.40 | 20.34 | $8.14 |
| Total | $21.65 | ||
Yes, that is all – $21.65. Based on my personal coffee scale, that’s a few day’s worth of normal cappuccino consumption. In fact I spent more on coffee during the time HIBP supported those hundreds of thousands visitors than what I did on additional hosting!
But of course there are other costs that go up with load as well, such as bandwidth and storage transactions. But they don’t matter. Hang on – why not?! Let me illustrate by way of bandwidth:
I used about an extra 20GB during the crazy periods, let’s see how much that costs:

Less than half a cappuccino. It’s the same deal with Table Storage transaction costs – they just don’t even rate a mention at the volumes we’re talking about here.
Call it all less than $25 for the entire exercise. This is precisely why I wrote Donations, why I don’t need them and why I’m now accepting them for “Have I been pwned?” – because the costs are just so low even when the scale temporarily spikes like this. I got some very kind donations during this period and they certainly covered the material costs, but as that blog post explains, the costs I really felt weren’t the ones that hit my hip pocket!
Summary
More than anything, what I took away from this experience is that short term large scale (relatively speaking) is dirt cheap. To that extent, I’d make sure that heaps more instances could be added early (I’ve already upped it to 10) and when I next see, say, four or more instances being used and load escalating quickly, I’d up the instance size very early as well. I’d far prefer to later make a decision to degrade the experience and save money than what I would suddenly realise that visitors are getting a sub-par experience because my scale couldn’t keep up with demand.
The other major thing is the observations around app readiness and dev ops. It is so important to have an app that’s already well-optimised and can be released quickly not just in scenarios like this, but even under normal circumstances. I cringe at some of the apps I’ve seen recently that have fundamental design flaws that mean they will be massively computationally expensive from day one – missing database indexes, heaps of stuff in session state, no bundling of clients assets – all of these things decrease the ability to scale and mean you’ll have to do it much earlier at much more cost. Same again when you look at deployment practices and it’s just one guy who compiles locally and pushes everything across the wire – it’s just entirely unnecessary.
But what I love most about services like Azure and the things this exercise has shown is that it truly democratises standing up websites of scale. Anyone can jump over to the portal right now and provision services that just a few years ago were the sole domain of infrastructure professionals working with “big iron” they’d order with lengthy lead times and serious cost. That you can now get started down that path on a cappuccino budget is enormously empowering.
Update, 21 Sep: I want to add an addendum here which might put some of the perf figures in perspective. After all this load had settled down, I noticed the CPU constantly increasing in utilisation even under light traffic loads. It would increase pretty incrementally up into 60% plus territory until the app was restarted then it would drop back to low single digit utilisation immediately. Obviously something was chewing up resources and I just couldn't explain it — I'd made no apparent changes in code that would account for the behaviour. Today, after filing a ticket with NewRelic on a separate issue, I've been advised by them that their current version (3.6.177.0) had been identified as buggy and leading to this behaviour. I rolled back to 3.4.24.0 and everything has gone back to normal. I've had a lot of API activity on the site today (up to 2k requests a minute) and I'm now seeing the CPU remaining very stable. The buggy NewRelic version was added on the 29th of August, a couple of weeks before the high traffic load. It's entirely possible I just never noticed the increased CPU because the organic load was light and I was also pushing a lot of changes very frequently that would reset the app and bring the CPU back down again. Of course it all begs the question — how much of the figures above were impacted by this? The answer is simple — I don't know! On the one hand, instances were being changed frequently enough that there was a lot of restarting of the app but on the other hand, clearly the site was placing an unnecessary burden on the CPU and that may well have been compounded under load. All I know is that it wasn't performing as well as it should but in the context of this blog post, it may well have helped demonstrate the scaling options, just don't use the figures as am emphatic "Azure does X when the traffic is Y" yardstick.
Update, 23 Sep: Further to the update above, I've just published Your Azure website CPU is going nuts and it’s not your fault which explains exactly what happened with the high CPU utilisation, what I saw before identifying the root cause and what I'm seeing now — massive difference!