Late last year I got all excited about continuous deployment with TeamCity when I wrote a five part series on using it in conjunction with web deploy. I then went on to write about Continuous code quality measurement with NDepend and TeamCity and Continuous project statistics with StatSVN and TeamCity. Needless to say, I’m a bit of a fan of continuous, automated processes which make the software development process more predictable and result in a higher quality product.
Speaking of quality, there are very few things that drop the quality bar faster than software with security vulnerabilities. Web application security is something I’m pretty passionate about, and for good reason. Nothing destroys reputation like security holes (I take it Gawker is still fresh in everyone’s minds), and when it comes to web applications, security holes are everywhere.
One of the problems with software security is that it’s easy for it to appear a bit like black magic, or at least like an entirely foreign industry to software development. The application security space is an alphabet soup of acronyms (XSS, CSRF, WAS), strange sounding attack practices (tab-napping, click-jacking, HomoXSSuality) and other odd concepts. Unsurprisingly, these concepts aren’t always clear and we end up with apps with holes in them.
So we (hopefully) do security scans before going live to make sure everything is safe and sound. These often take the shape of manual penetration tests or automated analysis. The problem we have though is the same one I touched on when I wrote about NDepend; finding quality or security issues right at the very end of the project is too late! You’re back between that rock and hard place where you’ve pushed all your risk to the end of the project and if it comes to bare, you’re going to need to choose between delivering a degree of quality problems versus likely delivering late and over budget. It’s not a nice position to be in.
Enter Netsparker
There are plenty of web application security scanners out there targeting a whole range of different budgets and purposes ranging from free to mega bucks. What I like about Netsparker is firstly, that there’s a free Community Edition so anyone can get a foot in the door but secondly, that it’s very, very user friendly. I’ve tried a number of tools over the years which in all fairness, may well be excellent and make perfect sense to the security specialist but for me sitting there wearing my developer hat, they’re often downright confusing.
Here’s why I like Netsparker so much:
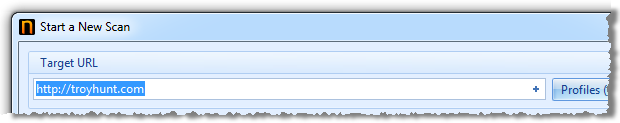
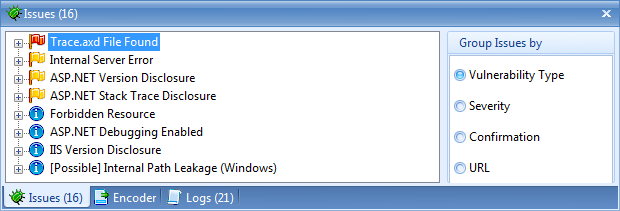
Enter a URL, click “Start Scan” and you’re off and running. Then you get feedback in a fashion which makes sense to anyone with half an idea about how a web app is put together:
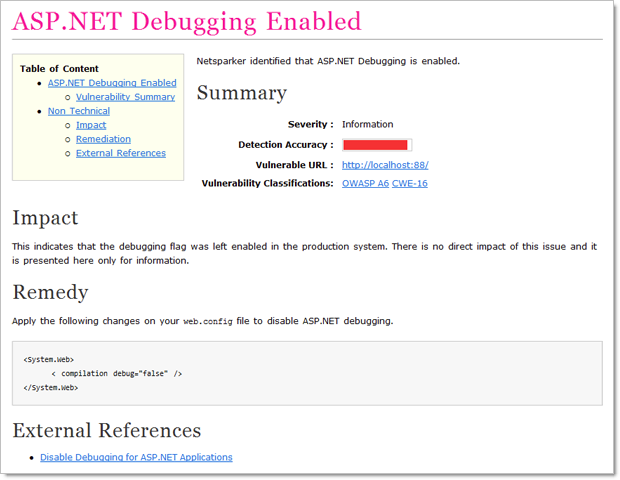
And a nicely formatted, clear explanation of what the vulnerability is, where you’ll find it in your app and how you need to go about fixing it, including external resources:
Each of my examples in this post is using a trial version of the Professional edition ($3k annual subscription), but there’s also a Standard edition ($1k annually) and of course the free community version I mentioned earlier on. Naturally, they each have different feature sets in line with their price variances but one really critical distinction I’ll make right now is that you can’t use the Community edition with TeamCity. More on that shortly.
This isn’t static analysis, Toto
When I wrote about NDepend and StatSVN, we were statically analysing code in that we weren’t actually executing anything; we were just looking at the source code. How Netsparker and many security analysers in general run is that they inspect an actual website. They make HTTP requests, they get, they post, they inject they look at headers and perform all sorts of activities that can really only be effective against an executing web application.
Because of this, the process and configuration in TeamCity is going to be a little different. Instead of just analysing code straight out of Subversion, we’re going to automatically deploy it to a web server then run Netsparker against it. Normally this is the sort of process you’d want to perform against a test environment which closely mirrors your production environment.
Configuring the build
I’m going to go back and use the same project and TeamCity configuration I’ve used in all the previous CI posts. The Netsparker build is going to run from the command line with a few parameters to instruct it what to scan. This is why the Community Edition is off limits for TeamCity – no command line runner.
We’ll start off with a new build configuration called “Netsparker”:
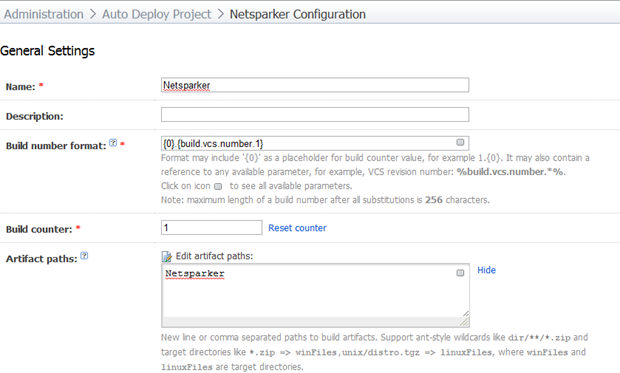
I’m using the same build format syntax I have in previous posts for the sake of clear identification of the VCS version and I’m going to pick up artifacts from the “Netsparker” directory.
In this build, we’re not actually going to need access to the source code but because I want to name the build based on the VCS version the build runs against, we still need to attach the build to a VCS root. The configuration is identical to how I set it up back in part 4 of “You’re deploying it wrong”.
Now for the engine room of the build – the build runner:
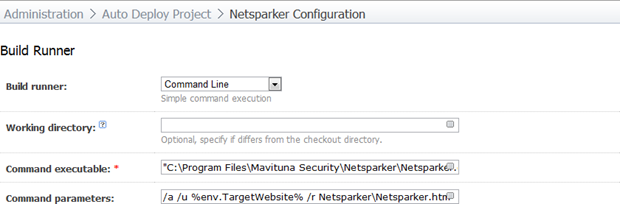
The command executable is simply the path of the Netsparker.exe file. In my case it’s the default path which is "C:\Program Files\Mavituna Security\Netsparker\Netsparker.exe". The command parameters are:
/a
/u %env.TargetWebsite%
/r Netsparker\Netsparker.htm
The available command line arguments are explained in full on the Netsparker support site but in short, run automatically, scan the URL in TeamCity’s “TargetWebsite” environment variable and save the report out into the “Netsparker\Netsparker.htm” path (this matches up with the artifact path in the general settings).
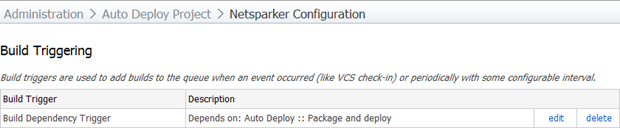
Next up is the build triggering. Now, you want to be a bit careful with this one. A Netsparker scan can be lengthy. That’s not a criticism of the tool; it’s simply that as a web application increases in size and complexity and particularly if network latency is involved, the number of attack vectors and the time taken to test them can increase dramatically.
For my purposes here, I’m going to trigger the build each time I successfully deploy the application. I’m going to run this against the build I set up in part 5 of “You’re deploying it wrong”.
In theory, for a real project, I’d love to make this dependent on the build used to deploy to a test server which would mean every time the app gets pushed out it gets automatically hammered by Netsparker and I end up with this beautiful audit history of security vulnerabilities over time. In practice, it depends very much on the duration of the build and the other dependencies on the build agent. This is a great case for a dedicated TeamCity build agent which did nothing other than run Netsparker reports and the mundane stuff (like actually compiling the project!) could be done by other agents.
Here’s how the trigger looks:
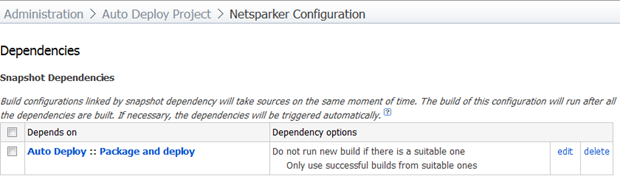
Moving onto dependencies, I want to ensure that this build only ever runs against a version of the application which has undergone the deployment build. This sounds a little odd because if it’s triggered by this build anyway, won’t that always be the case? The thing is though, we could always run this build manually and if the dependency doesn’t exist we’ll get a build number against a VCS version which may not have actually been deployed. There are also other advantages to explicitly tying the two builds together which we’ll look at shortly.
Here’s how my snapshot dependency looks:
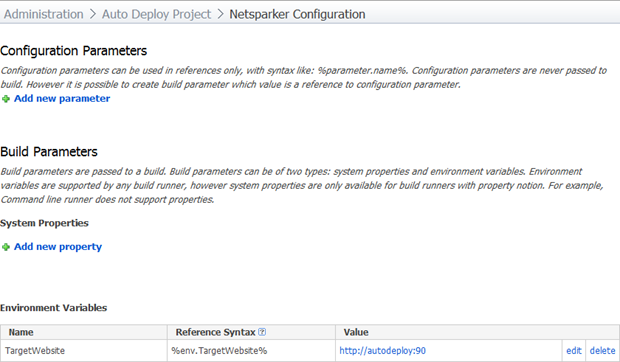
The final step in the build configuration is to define the environment variable we referenced earlier. This is going to be the path of the website we’re analysing and setting it here makes it a whole lot easier to either change later on without worrying about messing up the other parameters or to run the build on demand against URL. In fact you could run this build on demand against any URL in this fashion.
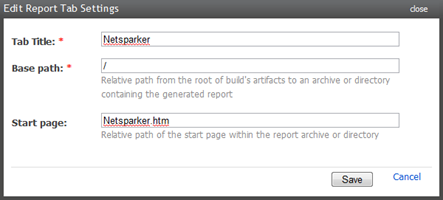
That’s everything in the build configuration; the last thing we’ll do is make it really easy to access the report by adding a Netsparker tab to the build page. Let’s head on over to Administration –> Server Configuration –> Reports tabs and create a new entry like so:
And we’re done! I can now either run it manually by hitting the “run” button on the build, or because this build is triggered by the “Package and deploy” build which is triggered by the “Build entire solution build” which is triggered by (stay with me here), a VCS check-in, all I need to do is commit some code. And here’s what we get:
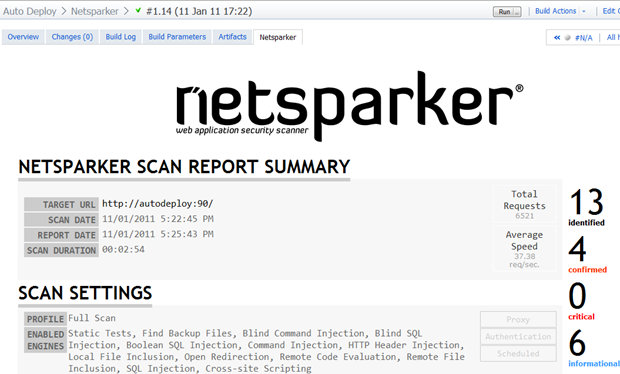
Fantastic! An entire Netsparker report auto-generated and logged against the project with clear traceability back to the source code, build history and if they exist, unit tests. And it’s all easily accessible on demand via the TeamCity interface. Nice.
Other things to reflect on
Getting back to durations, take a look at the build statistics:
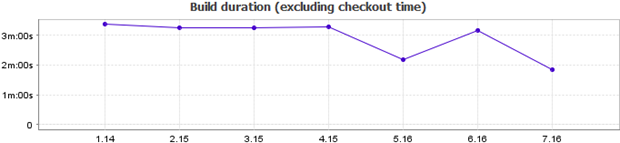
Keep in mind that this is against a straight out of the box, ASP.NET Web Application from Visual Studio 2010. The app does only the absolute bare basics. I’ve frequently seen applications which take over an hour to scan and even those were pretty basic, albeit with greater latency than running against a local app on the same machine.
Earlier on I mentioned the snapshot dependency has some other advantages. By tying the builds together via dependencies (not necessarily triggers, just dependencies), we now get a picture like this (I’m looking at the package and deploy build here):
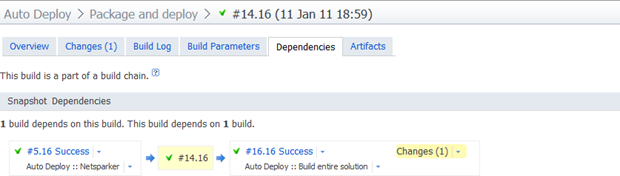
What we’re seeing here is that the Netsparker build #5 used VCS revision 16 and this build ran against the same codebase as build #14 of the “Package and deploy” build which ran against the same codebase as build #16 of the “Build entire solution” build. It ties the whole picture of the application lifecycle together very nicely.
One thing that can be a little tricky about getting the build right is trouble shooting any issues when Netsparker is running unattended. Something I found helpful was to take the command being executed by the build runner and run it directly on the machine with the agent. You’ll find something similar to the following in the build log:
Start process: C:\Windows\system32\cmd.exe /c "C:\Program Files\Mavituna Security\Netsparker\Netsparker.exe" /a /u http://autodeploy:90 /r Netsparker\Netsparker.htm
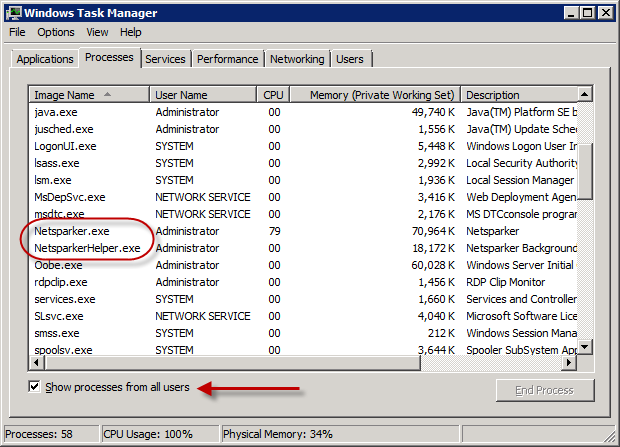
The other thing that’s not always clear – particularly on a long running build – is if the process is actually still running. If you jump into task manager, you should see a couple of Netsparker processes running (make sure you show processes from all users):
Not big things, but they can save quite a bit of pain.
Summary
The great thing about these automated, continuous processes is that they take a huge amount of risk out of the project by dealing with issues early. Tweaking code and changing direction two weeks into a project is an order of magnitude easier than when you’re two months into a project.
In terms of Netsparker, the information this provides on even a very basic project can be invaluable. Just on a vanilla ASP.NET application it identified passwords being sent over HTTP, MAC not enabled in the viewstate, an internal server error (no connection string configured for the membership provider), auto-complete enabled, ASP.NET version disclosure, stack traces exposed, unencrypted viewstate and debugging enabled. That’s on an app where I hadn’t written a line of code – just wait until you see how many other vulnerabilities it will identify in a typical web app.
Ultimately this becomes another arrow in the quiver of automated code quality metrics; StyleCop, FxCop, duplicates finder, NDepend, StatSVN and Netsparker. There’s enough info in there to make a very positive difference to the quality of code and consequently the effort and cost of developing, maintaining and extending the app in the future.