Something that has always struck me as a bit unique about the software industry is the huge variances we see in professionalism. Consider industries such as medicine or aviation; the lower bounds of their professionalism is comparatively high and the deviation of expertise within the practitioners is comparatively low when compared to software development. Of course there are exceptions – every now and then a doctor malpractices or a pilot crashes – but these are relatively rare occurrences compared to how often poor quality code is written.
You could argue that this is quite possibly due to these being professions which hold peoples’ very lives in their hands but you could just as easily extend the analogy to numerous other professional pursuits; law, teaching, even professional athletes. There’s just something a little bit different about writing code for a career.
No doubt part of the problem is that there are really no entry criteria to becoming a programmer. Sure, there are degrees and certifications but often times there is a large gap between formal academia and practical knowledge. I find it interesting that industries like construction or real estate require practitioners to be formally certified to the same base level as their peers (at least this is the case in Australia), but software development remains a very informal pursuit.
Is it any wonder, given the often casual career path of the software developer, that we now see such huge variances in software quality?
What exactly is “quality”?
I spend a lot of time with a pretty broad range of people in various places around the world delivering software. A constant challenge I have is in ensuring that “quality” is pervasive throughout the execution of software development. The air-quotes around quality are intentional as it is a terribly elusive attribute which is very difficult to consistently attain at a high standard.
The first problem you have with quality is that it’s subjective. Ask a room full of skilled developers what level of code covered by automated test cases is acceptable and I assure you there will be more than one answer. It’s not that many of them are wrong; it’s simply that there are different schools of thought in terms of what’s practical.
The second problem is about measurement. Once you can actually agree on the practices which define quality you need a form of measurement in order to indicate the degree of compliance which has been achieved. We need quality measures.
Finally, the whole process needs to be repeatable. If quality is to pervade across projects, or indeed across an organisation, we need to be able to easily repeat the measures so that we can repeat the outcome.
In short, we need agreed measurable quality objectives that can be quickly and easily gained from projects. Enter NDepend.
About NDepend
A little while back I got an email from Patrick Smacchia of codebetter.com asking if I’d like to try out NDepend. This was actually pretty timely as it had been on my “to do” list for a little while as a potential means of getting more insight into code quality.
NDepend is a Visual Studio plugin which performs a range of analyses across a solution, either during design time or retrospectively across an existing project. It provides a series of code metrics (76 of them at present) which are analysed and reported on by the tool.
There’s a free trial available on the website with a subset of the professional edition or the full blown tool is available for around US$400.
Getting started
For the purposes of this post, I’m going to run NDepend over a pet project of mine. It’s been my “playground” since my first foray into .NET about many, many years ago so it’s unsurprisingly messy but that’s all the better for illustrating the sort of bad practices we can identify with the tool.
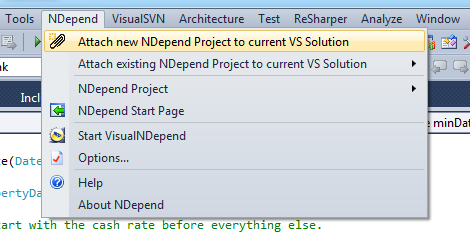
First up, the Visual Studio integration makes getting up and running pretty simple. You’ll see a new “NDepend” menu item with the first option allowing you to attach a new NDepend project to the current solution.
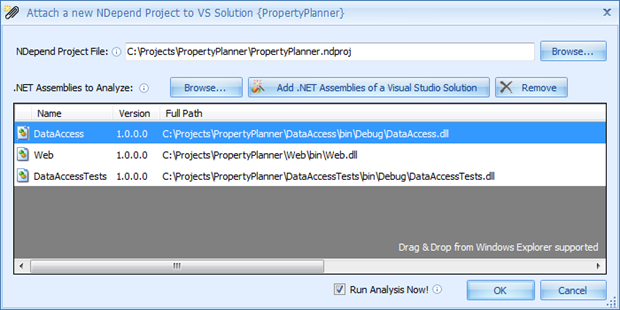
You’ll then see a list of assemblies generated by the project and available for analysis. This project only has a simple web front end, a data access tier which also performs the business logic and a test project for the same. By default, NDepend will create its own project file with a .ndproj extension in the root of the solution where it will store configuration information.
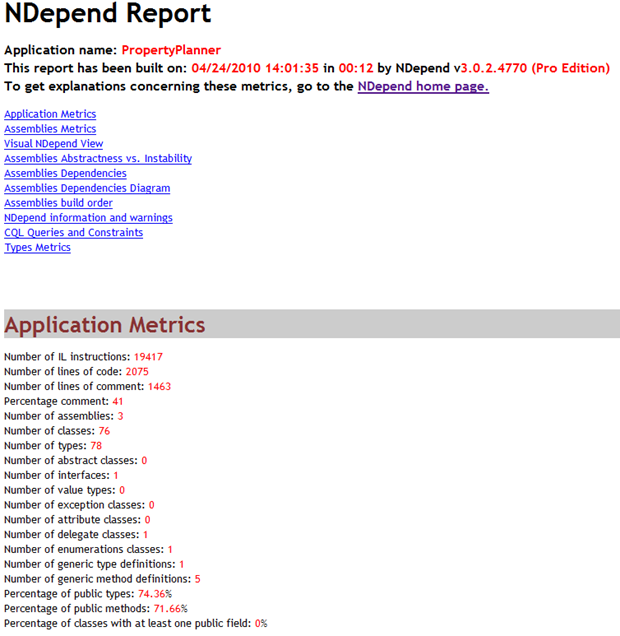
I’ve left the “Run Analysis Now!” box checked so after accepting the screen above, NDepend will do its thing across the solution and automatically generate a very extensive HTML report listing every single finding. This is a great document for keeping the current state of the app on record or perhaps as a starting point for evaluating quality. It all gets spat out into the NDependOut folder so it can be zipped and redistributed if necessary. Here’s the summary page for my project:
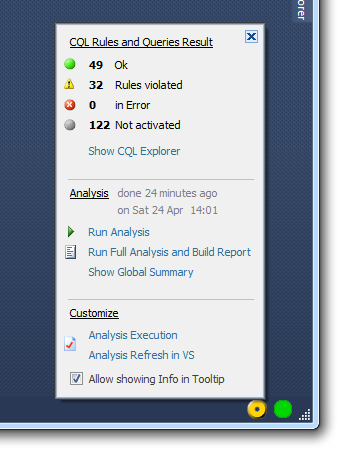
The final thing you’ll notice after first analysing the solution is a new donut style symbol down the bottom right of the IDE. It will almost certainly be orange (there will be findings), and it sits in just next to the ReSharper “Errors in solution” icon (which you are hopefully already running because you care about productivity). Hovering over the icon will give us some stats on how well the project adheres to the rules NDepend defines.
Configuring NDepend windows
With the analysis done it’s time to start taking a look at the findings. First up though, let’s get the NDepend windows we need to help work through those violated rules. You’ll find a whole series of windows available:
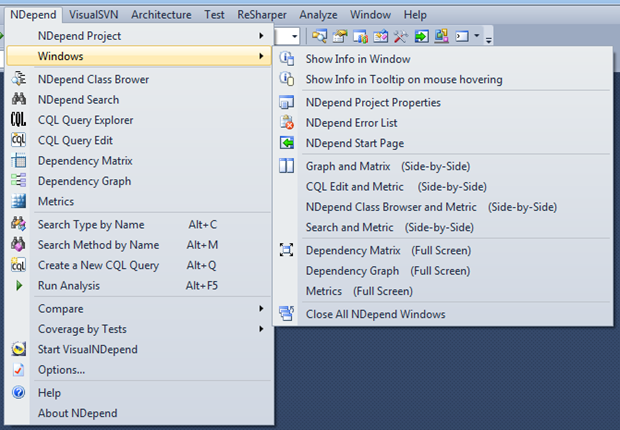
To get started with understanding where the rule violations are occurring, there are two critical windows; The CQL Query Explorer and CQL Query Editor. I’ve docked these guys together over on the second monitor with the IDE front and centre in the primary.
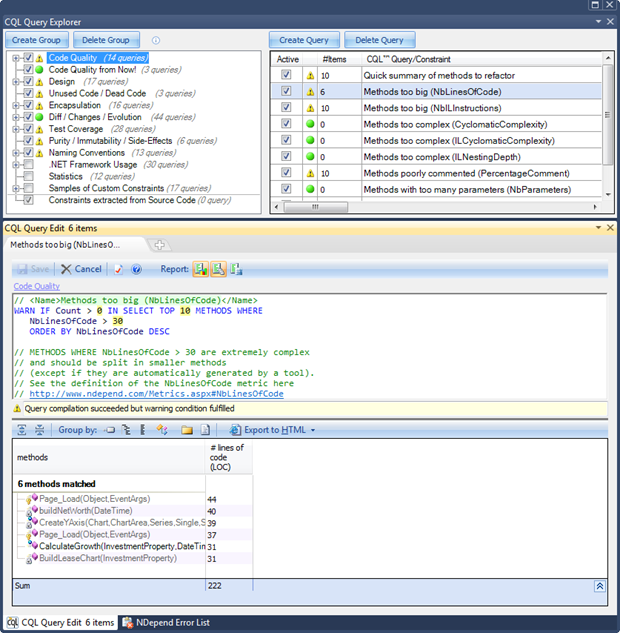
You’ll see four panes above but they exist inside two discrete windows. The first contains two columns; a grouping of quality measures followed by individuals tests. Everything beneath there is the CQL query (more on that shortly) and the results of the query. This is everything you need to get started with investigating potential quality issues with the app.
About CQL
Code Language Query, or CQL, is NDepend’s own query language for inspecting your code. It’s syntactically very similar to SQL so it shouldn’t appear too foreign. CQL defines all the rules against which code is managed. Take the example in the screen grab from above:
WARN IF Count > 0 IN SELECT TOP 10 METHODS WHERE
   NbLinesOfCode > 30
   ORDER BY NbLinesOfCode DESC
Very simple stuff, nothing more to be said for the structure really. In terms of customising it, the CQL can be modified – such as to change the metric thresholds – and it’s then saved back into the .ndproj file which will then persist across other users assuming it’s shared via source control. To be honest though, I found all the default queries pretty spot on although I could see people tightening the criteria a bit if they wanted to get a bit more idealistic about code structure.
One area I would tweak a little is in ensuring generated code is not picked up in the reports. I saw several metric thresholds exceeded by LINQ to SQL code which in this context is a false positive. Obviously anything auto-generated is not directly maintained and NDepend is not the place to be assessing that quality. However the CQL could exclude these by using regular expression syntax such as seen in the uppercase naming convention:
WARN IF Count > 0 IN SELECT TOP 10 METHODS WHERE
  !NameLike "^[A-Z]" AND
Obviously regex exceptions for auto-generated code will require a suitable pattern to be matched so perhaps ignoring files with <auto-generated> decorations would be a good place to start.
Prioritising the measures
76 different measures is pretty extensive by anyone’s standards. In a perfect world you’d start out with a green field development with NDepend closely watching your progress and alerting you to any deviations from good practice as you go along. However in the situation I’m most interested in – assessing the quality of existing software – we need to be a little more selective.
Here’s what we start out with:
NbLinesOfCode, NbLinesOfComment, PercentageComment, NbILInstructions, NbAssemblies, NbNamespaces, NbTypes, NbMethods, NbFields, PercentageCoverage, NbLinesOfCodeCovered, NbLinesOfCodeNotCovered
NbLinesOfCode, NbLinesOfComment, PercentageComment, NbILInstructions, NbNamespaces, NbTypes, NbMethods, NbFields, Assembly level, Afferent coupling (Ca), Efferent coupling (Ce), Relational Cohesion(H), Instability (I), Abstractness (A), Distance from main sequence (D), PercentageCoverage, NbLinesOfCodeCovered, NbLinesOfCodeNotCovered
NbLinesOfCode, NbLinesOfComment, PercentageComment, NbILInstructions, NbTypes, NbMethods, NbFields, Namespace level, Afferent coupling at namespace level (NamespaceCa), Efferent coupling at namespace level (NamespaceCe), PercentageCoverage, NbLinesOfCodeCovered, NbLinesOfCodeNotCovered
NbLinesOfCode, NbLinesOfComment, PercentageComment, NbILInstructions, NbMethods, NbFields, NbInterfacesImplemented, Type level, Type rank, Afferent coupling at type level (TypeCa), Efferent coupling at type level (TypeCe), Lack of Cohesion Of Methods (LCOM), Lack of Cohesion Of Methods Henderson-Sellers (LCOM HS), Code Source Cyclomatic Complexity, IL Cyclomatic Complexity (ILCC), Size of instance, Association Between Class (ABC) Number of Children (NOC), Depth of Inheritance Tree (DIT), PercentageCoverage, NbLinesOfCodeCovered, NbLinesOfCodeNotCovered
NbLinesOfCode, NbLinesOfComment, PercentageComment, NbILInstructions, Method level, Method rank, Afferent coupling at method level (MethodCa), Efferent coupling at method level (MethodCe), Code Source Cyclomatic Complexity, IL Cyclomatic Complexity (ILCC), IL Nesting Depth, NbParameters, NbVariables, NbOverloads, PercentageCoverage, NbLinesOfCodeCovered, NbLinesOfCodeNotCovered, PercentageBranchCoverage
Size of instance, Afferent coupling at field level (FieldCa)
The first measures I decided weren’t really relevant were some of the naming conventions. Partly this is because I already have conventions defined in ReSharper and StyleCop for my own development and partly it’s because from a quality perspective, I just don’t think they’re that important.
Don’t get me wrong, a coding convention is indeed important (certainly I’ve written enough of them over the years), it’s just that in the case of software developed by a third party so long as some form of convention is followed across a project I really don’t care which one it is. It may well differ to the default ones in NDepend (some of mine certainly did).
For the purposes of illustration in this post, I’m going to distil the 76 down to six which are good representative sort of the sort of quality measures NDepend does a good job of identifying. I’m not saying these are the most important; they’re just good illustrations of what the tool does.
Metric 1 – efferent coupling
Efferent coupling refers to the number of code elements any given single code element has dependencies on. The greater the number of dependencies, the higher the efferent coupling will be.
The problem with ever increasing dependencies is that it’s often an indication the single responsibility principle is being broken. Put simply, the one class is quite likely trying to do too many different things and as a result is becoming unwieldy. Single responsibility is summed up really well in Uncle Bob’s SOLID principles and Los Techies do a nice motivational poster out of it too:

NDepend sets a default efferent coupling threshold of 50; once a type depends on 50 or more other types you’ll get a warning. This is a really good opportunity to give ReSharper a bit of exercise and refactor some methods out to more specific types suitable to their discrete intentions.
Metric 2 – large methods (lines of code)
By default NDepend will look for methods exceeding 30 lines. Fortunately it’s smart enough to only look for logical lines of code and hence ignores blank lines, comments and lines with only braces as well as structures spread over multiple line such as LINQ statements and object initialisers. What this means is that regardless of coding style what you’re really getting in this report is methods which have more than 30 lines of actual instructions.
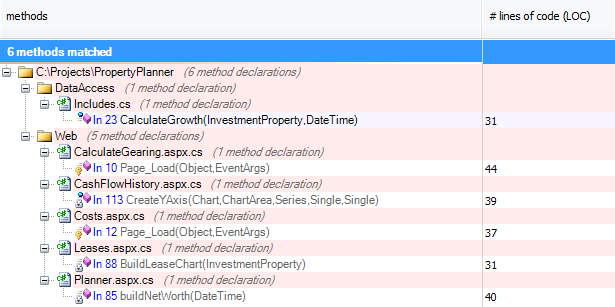
The problem with long methods is that they’re usually trying to do too much which negatively affects both legibility and maintainability. In the “BuildLeaseChart” method above with 31 lines, for example, the code is configuring visual attributes of a chart, loading data and enumerating through series within the chart. It’s too much happening in one place and it needs to be refactored out into separate concerns.
Metric 3 – large methods (IL instructions)
An increasingly large number of IL instructions is reflective of an increasingly complex method. In the same strain as lines of code, complex methods will likely have a negative impact on both legibility and maintainability. NDepend looks for methods where more than 200 IL instructions are occurring.
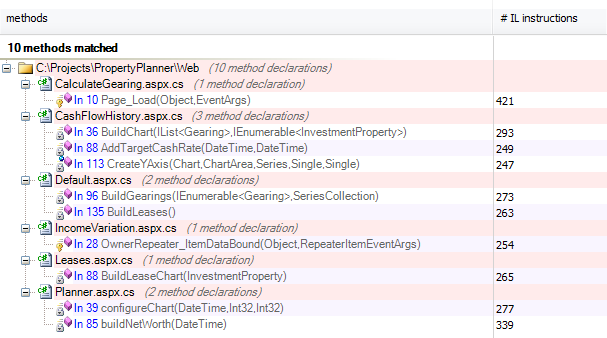
In the example above, the Page_Load event in the first finding was performing 421 instructions as it performed calculations and updated fields in the UI. Ignoring for a moment that this shouldn’t be happening in code-behind and certainly not directly in Page_Load (ah, the joy of experimental projects), it’s simply trying to do too much heavy lifting in one place. Refactor time again.
Metric 4 – cyclomatic complexity
 The cyclomatic complexity of a piece of code is an indication of how many potential paths may be taken in its execution. As the potential paths increases, so does the complexity. Wikipedia illustrates this with a simple example:
The cyclomatic complexity of a section of source code is the count of the number of linearly independent paths through the source code. For instance, if the source code contained no decision points such as IF statements or FOR loops, the complexity would be 1, since there is only a single path through the code. If the code had a single IF statement containing a single condition there would be two paths through the code, one path where the IF statement is evaluated as TRUE and one path where the IF statement is evaluated as FALSE
So from a quality perspective, less potential routes of execution means less complexity, easier legibility and simpler maintenance. NDepend sets a default threshold at 20 per method after which you really should be thinking about the refactoring route again.
Running it over my test project I actually came out clean (maximum was 10) but I suspect this is more by virtue of it being pretty simple in nature than by it being well designed! For complex projects, satisfying the cyclomatic complexity rule of 20 or higher would flag the need for further investigation.
Metric 5 – variables per method
Another reflection of unnecessary complexity is when the number of variable declarations within a method grow too large. This one is inevitably closely related to the number of lines per method and there’s certainly some crossover in my examples.
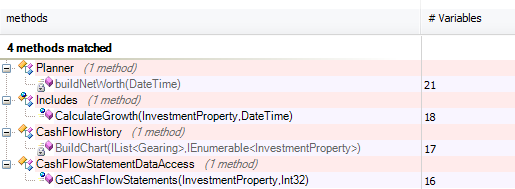
Reviewing the code, the reasons for this are similar to previous examples; too much multitasking in one discrete method and not enough separation of concerns.
Metric 6 – test coverage
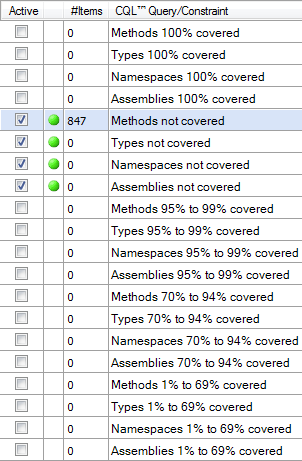 Interestingly, this one wasn’t enabled by default. It surprised me a little simply because test coverage is usually considered such an important quality measure. Then again, you’ve got 20 measures which include a number you do want to satisfy – such as those with high percentages of code coverage – that it wouldn’t make sense to enable them all by default.
Obviously you could go through and select the lower bound ranges as well as the four I’ve ended up highlighting which look for code with no coverage at all. You might say, for example, that anything less than 70% coverage is insufficient and therefore select the four which represent 0% plus the four rated 1% to 69%.
When I ran the selected measures over my code I got a lot of results. 874 of them in fact which sounds pretty scary on the surface of it. However delve a little deeper and we get back to generated code again. If we take out the LINQ to SQL classes (break out that regex again), we’d actually get down to a pretty manageable level.
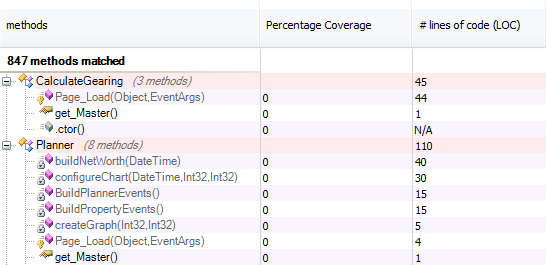
There are thousands of very good posts out there by more adept testing practitioners than me about why automated tests are important so I won’t attempt to justify the inclusion of this metric here. Just do it and do it to the highest practical degree (the emphasis is fodder for another post, another day).
Visualisations
Visual representations of projects are pretty neat ways to get a quick feeling of code structure without actually delving into the syntax itself. There are a number of tools around to do this and Visual Studio 2010 even comes with sequence diagrams and architecture explorer graphs baked in if you can afford to shell out for the Ultimate edition.
There are three key visualisations supported by NDepend which I’ll touch on shortly. One thing that’s a bit difficult to show here is that they’re all interactive and provide drilldown or other data representation techniques that aren’t done justice by static screen shots. To get a bit of an idea of how this really works, check out the dependency management video over on the NDepend website.
Visualisation 1 – dependency graph
The dependency graph allows you to easily visualise project interdependencies. In the case below, I’ve selected the DataAccess assembly (hence the orange highlighting) which then illustrates assemblies it depends on in blue and assemblies dependent on it in green. The size of each node is directly relevant to the number of lines of code it contains, although this can be configured to reflect other assembly metrics. This is obviously a small project hence a pretty simple graph but you can see how it would be a real help in trying to understand the structure of a large project very quickly.
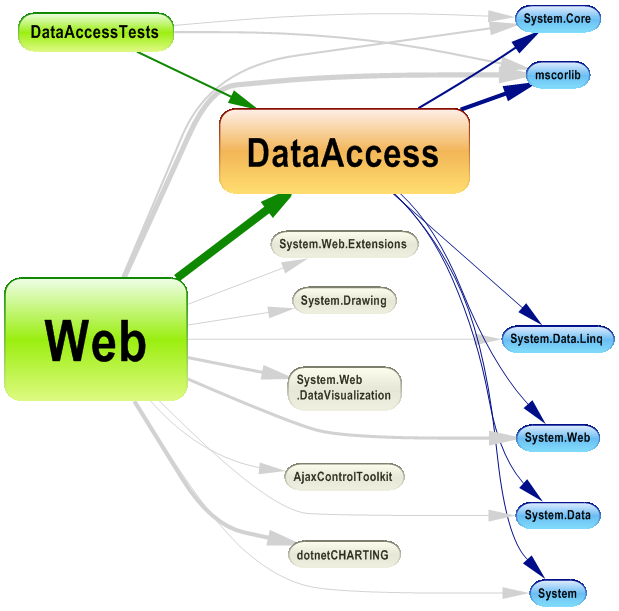
Later on, I generated a dependency graph over a large enterprise solution with many projects and external assembly dependencies. I can’t share it here, but let’s just say that it looked like someone dropped a plate of spaghetti on the screen! Some drilldown and filtering is likely in order for more complex code bases.
Visualisation 2 – dependency matrix
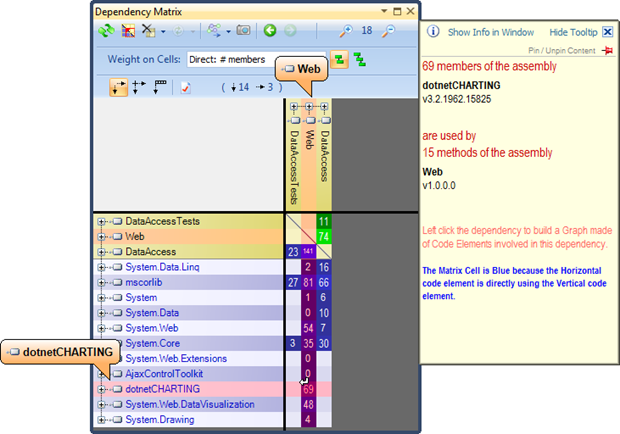
The next visualisation shows inter-assembly dependencies on a matrix including the scale of the dependency in terms of numbers. What you’re seeing in the table below is the project assemblies on the x axis coupled with both the project and external assemblies on the y axis. The way to read this, in say the case of the Web and DataAccess projects, is as follows:
74 methods in the Web assembly are using 141 assemblies in the DataAccess assembly.
So this gives us an idea of how heavily dependent each assembly is on the others both from the same solution and from external assemblies.
Visualisation 3 – metrics graph
By far the coolest, if not the most holistic, visualisation is the metrics graph. What you’re seeing below is three tiers of hierarchy starting with each analysed assembly in its own sub-window which then shows each class in a box illustrated by the radial gradient and then each method within in the class in a sub-box with another radial gradient. In the example below, the size of the method box is related to the number of lines of code in the method.
The advantage of this visualisation is that it makes it very easy to see if large volumes of code are concentrated in the one class or method, neither of which is desirable (single responsibility principle, code legibility, maintenance). A logical step for users of NDepend is integration with a CI environment and the generation of reports after nightly builds. I’ve not tested this myself but there are some good examples out there of integration with Team City and another with CruiseControl.NET. Having an auto-generated report you can load up in a browser each day is a pretty neat way of tracking quality for projects currently under development. There’s a Hanselminutes podcast interview with Patrick from last year (BTW, this is very good interview which gives you a fast and practical intro to NDepend) which cautions the use of NDepend rules for invalidating a build. As Patrick points out, there is the potential for generated code to legitimately break rules and this alone should not be cause for a broken build. Exceptions may be added to the CQL via regex as I mentioned earlier so this path could potentially be explored further – with caution. There were no big show stoppers for me; it was more a matter of some rough edges that could do with a bit of polishing. A few spelling errors (“explicitely”) and some UX stuff like the theming of options dialogs and windows not being real consistent with the native VS ones. Aesthetically it’s not quite up to the standard of ReSharper of VisualSVN but we’re really talking about eye candy here. In terms of rules, given the CQL is configurable anyway there’s not much point arguing the merit of the various thresholds. What I would like to see is easier configuration to ignore the warnings about generated code which you’d expect should be a no-brainer for files like LINQ to SQL .dbml and associated code-behind. I also felt the objective around code comment rules could be better serviced by clear naming and disclosure of intent but of course you can always turn these off. NDepend is not a panacea for code quality. It won’t magically turn bad coders into good ones nor will it make remediating a bad project easy. It also won’t tell you where quality issues exist in your data or UI layers, the scope is clearly focussed on .NET assemblies. The strength lies in the insight it provides in order to make decisions about code structure. For development teams this means keeping the codebase on track and being advised early when deviations start to occur. The most relevant context of NDepend for me is in code review and for my purposes NDepend has a lot of potential. I can’t see myself defining any single non-negotiable metric which a project must pass to be deemed “quality” but I can see the tool being used to very quickly get that 10,000 foot view of what’s going on. I can also see the HTML reports it generates being used as a reference point and being sent back to the developer with some encouraging words. It’s would be interesting to see how ISVs in particular respond to an NDepend report, particularly if it’s not flattering. Regardless of customer satisfaction with the function of an application, NDepend provides the means to objectively and automatically quantify some key quality measures that have previously gone unattended. Of course if serious issues are identified, it’s probably reflective of a fundamental misunderstanding of good design principals and the subsequent refactoring may simply be done with the objective of passing the measures rather than addressing the underlying quality issues. But I’m sure we don’t suffer from this sort of lack of professionalism in the software industry, or do we?!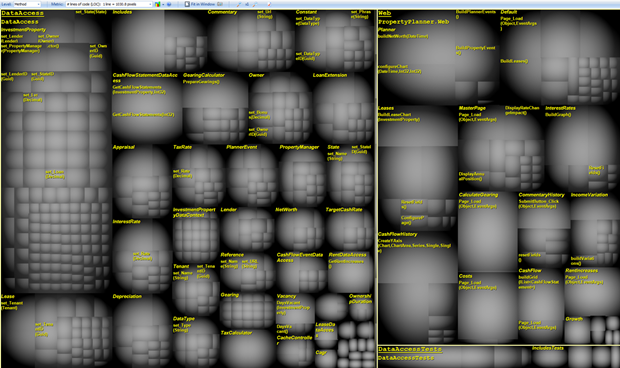
<br><i>[click to enlarge]</i></a></p>
Continuous integration-integration
Rough edges
Summary