I’ve always written very publicly about how Have I been pwned (HIBP) was conceived, built and indeed how it performs. If ever there was a time to look back at that performance, it’s in the wake of the first few days after loading in the Ashley Madison breach. I want to share the “warts and all account” of what I observed over the three days of utter chaos that ensued.
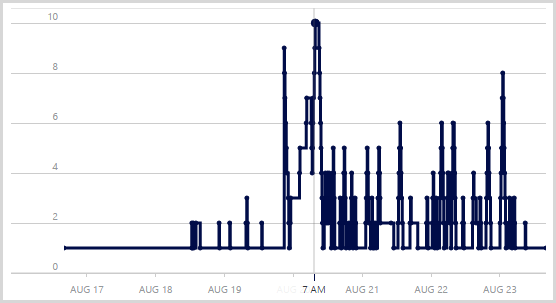
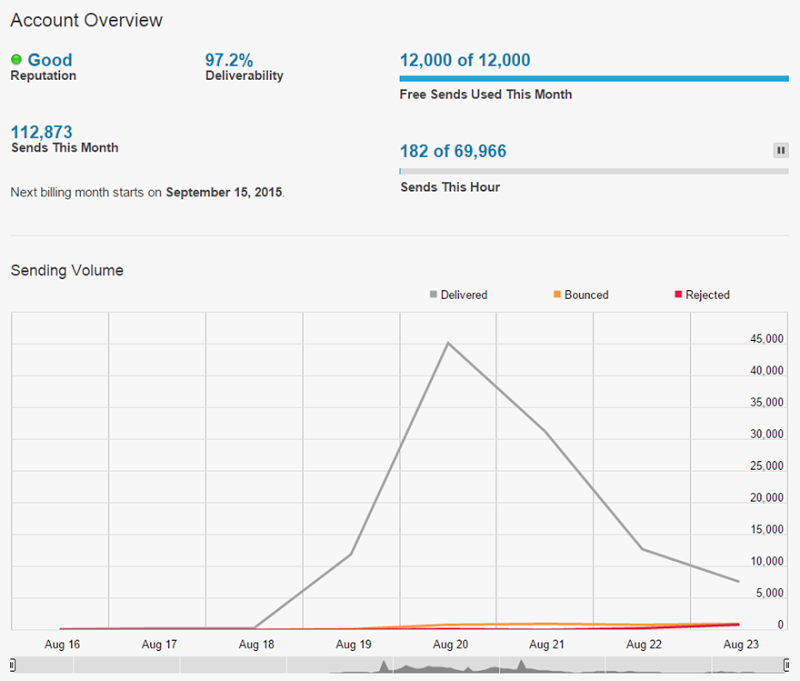
I first learned of the incident at about 6am local on Wednesday which was very shortly after the torrent first hit the air (remember, I’m in Australia which is in the future for most of you). During the day, I pulled down the breach, processed it and eventually got the data live at about 20:30 that night after which the traffic rapidly ramped up until it peaked at 11:00 the following morning. Here’s a three day graph from Google Analytics of Wednesday 19, Thursday 20 and Friday 21 (Saturday was also exceptionally busy but all the New Relic graphs are three days so I’m going to stick to that timeframe):
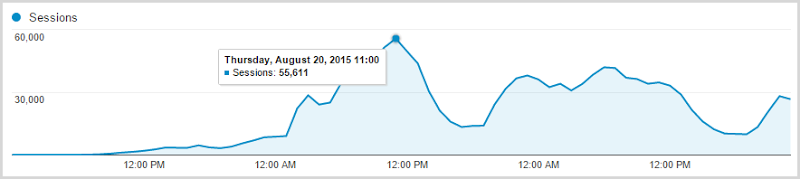
Consider this for a moment: the site went from 96 sessions an hour at it’s quietest period to 55,611 at it’s busiest. When we talk about cloud scale, this is it personified – I saw a 58,000% increase in traffic in a little over 24 hours. That’s a “headline” figure, but here’s another one for you and it’s this performance graph over those same three days:
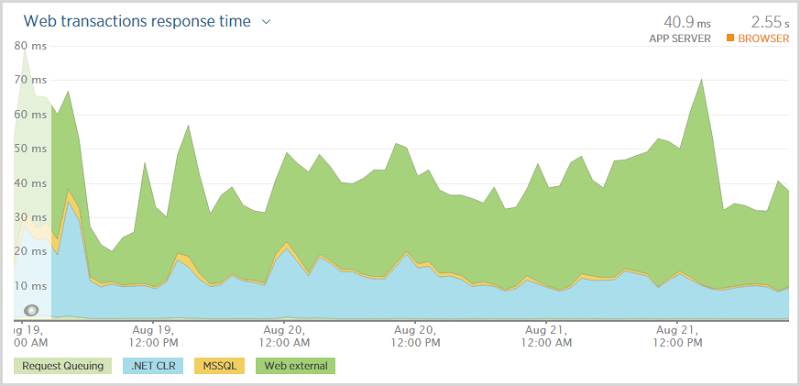
What I love about this graph is that it in no way correlates with this change in traffic! In fact the transaction time is probably a little higher very early on when the traffic was near non-existent. I got the scaling of Azure good enough that the performance didn’t degrade whether there were a dozen people on the site or, well, this many:
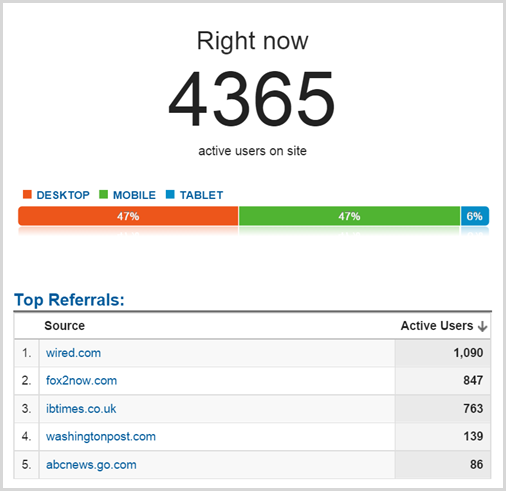
I snapped that from Google Analytics at 05:46 on Thursday morning in the hour that saw 34,240 sessions so pro rata, the peak hour with 55,611 was more like 7k simultaneous. Actually, call it more like an average of 8.5k simultaneous sessions over the period of an hour because this is according to Google Analytics and I find real traffic is usually about 20% higher due to ad blockers and other tools that block tracking. Actual peak within that hour? Who knows, something more than 10k probably.
Now I said this would be a “warts and all” analysis which means I need to show you this:
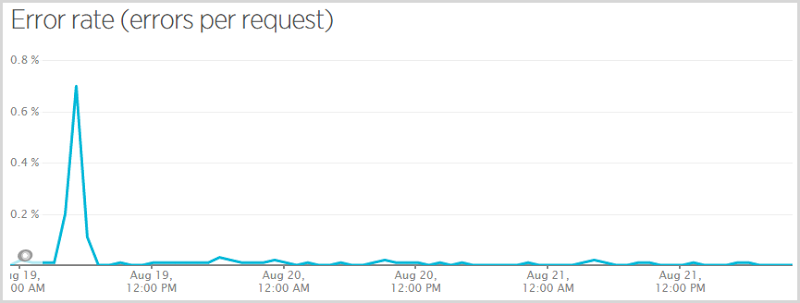
When I initially pushed the code live that excluded Ashley Madison data from public search results (more on that here – that’s a very important post on how I made a judgement decision that this data should not be publicly searchable), I got myself a null reference exception when someone subscribed to the service, verified their email and wasn’t in the Ashley Madison breach. They still subscribed successfully and nobody that was in the breach missed being told they were there, but those who weren’t got themselves an error. I had Raygun go nuts at me so I fixed it and pushed it quickly but it meant 0.7% of requests had an error in the hour that data point covers. Here’s a more representative graph of the error rate across the busiest period:
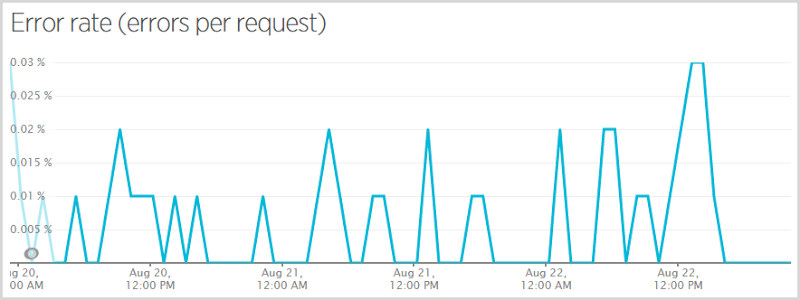
This is still a three day period but it skips the Wednesday and just does Thursday, Friday and Saturday. That works out at an error rate of 0.0052% (for some reason New Relic only gives me that figure on the smaller graph on the front page) or in other words, 99.9948% of requests succeeded. So what were the ones that failed? Here we go:
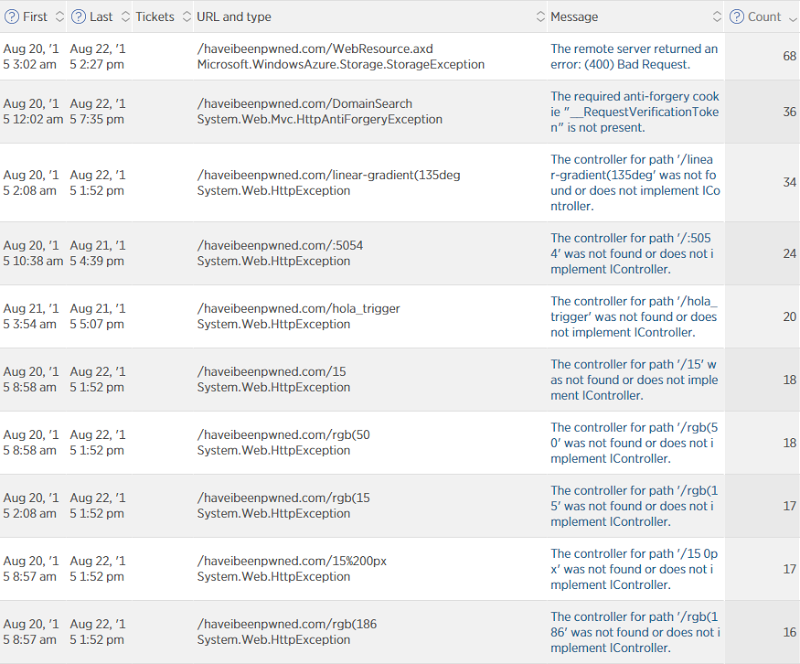
These are predominantly not user-facing errors. The WebResource.axd one is for automatic logging of content security policy violations using NWebsec (incidentally, my Pluralsight course on this went live in the middle of all the chaos!) and that sometimes fails when very large violations won’t fit in table storage (for some reason I’m seeing large data URIs in there sometimes). There’s an anti-forgery exception when people (or robots) are trying to do a domain search and not pass the anti-forgery token (a favourite of security scanning tools) and a bunch of just entirely irrelevant errors such as malformed requests to non-existent resources for various reasons completely beyond my control. In fact if you take these out of the error percentage, you’re getting so close to 0% of actual user-facing errors that it’s near perfect – less than one actual error per 100,000 requests. The very occasional table storage timeout or SQL Azure not being contactable. Do note that this in no way correlates with load – sometimes I’ll see an error of this nature with only a handful of people on the site. Of course I’d love to get it down, but I’m mostly happy!
One of the things I’m most interested in when serious volumes hit is where the load goes. I know where the volume is – it’s hitting the front page and searching for accounts – but where’s the hard work being done? I found the biggest area where performance was being hit was when people signed up for notifications:
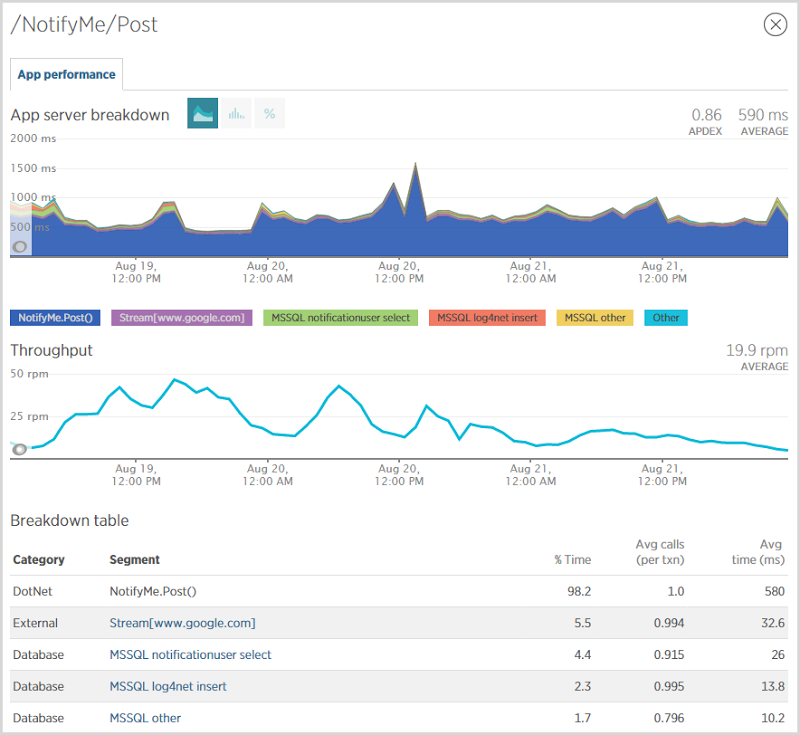
I had about 90k people sign up for notifications during this period and as you can see from the chart above, it’s sloooow. The problem is seen in the NotifyMe.Post() event above which on average, took 580ms. This event is making a direct connection to Mandrill’s SMTP server to send the verification mail which is enormously inefficient. What I really should be doing is dropping it into a message queue, sending an immediate response to the user then have a WebJob operating as a background process to send the email out some seconds later. This would stop the mail delivery blocking the response so the user would probably get some half a second of their life back. On the other hand, if I use a WebJob to actually send the mail then it’s still executing on the web server so whilst I would have liked to have been able to make an argument about the improved scalability of the system by doing this, I’m merely shuffling the same load between different processes running on the same infrastructure. Of course there’s a resiliency upside by communicating with storage within Azure rather than a mail server somewhere completely different, but I wouldn’t really get back any CPU cycles unless I distributed the WebJob to other infrastructure.
On the back end of the system, here’s what I was seeing in the database:
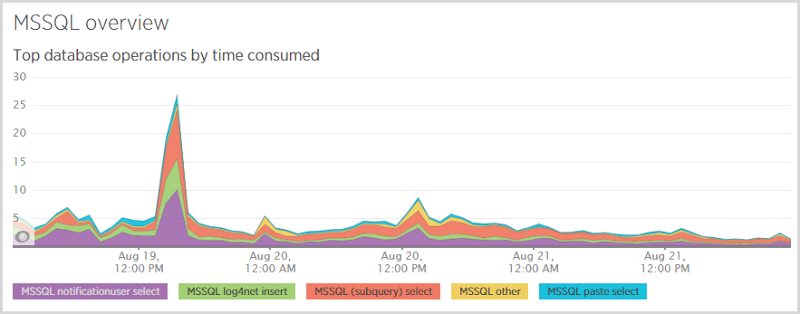
The big standout here is the “notificationuser select”; when someone subscribes for notifications, I first check to see if they’re in the database so I know whether to send them a “Hey, you’re already subscribed” email or a “Here’s your verification token” email. I also need to select from that table after they follow the verification link which pulls back their record by token. Those selects are expensive and you see it represented again in the database response time:
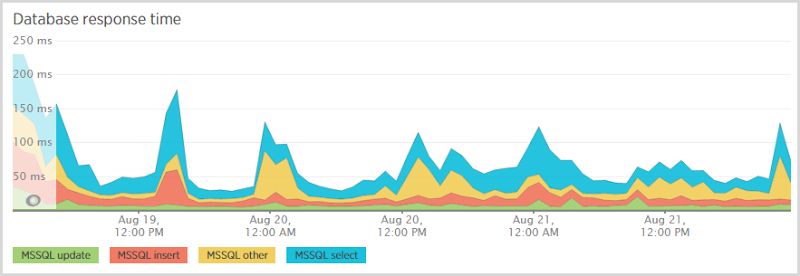
Now over this period I did change SQL database scale a few times (more on that later) so I expect some fluctuations, but evidently the select is still the lion’s share of cost. I need to look at that table a little closer and see what’s going on with the indexes. They’re in place for queries both by email and by token, but for a table with about 250k rows in it, things should be running faster than that.
One interesting stat I got related to this was the distribution of select queries to the notificationuser table by caller:
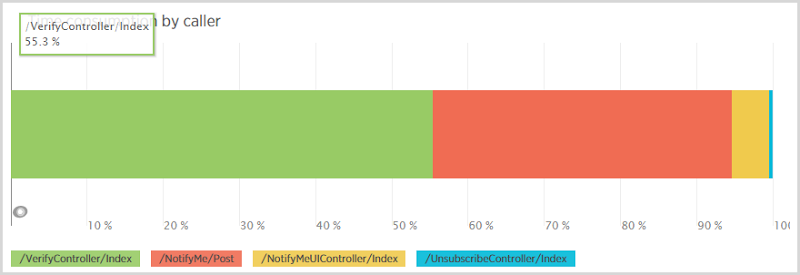
Now think through the workflow here: someone makes a post to the NotifyMe controller to subscribe for notifications then 80% of the time they come back and hit the VerifyController after they get the email (there’s a 20% rate of attrition I assume through either not receiving the email or people signing up other addresses). The point is that there should be way more calls from the signup (the “/NotifyMe/Post” caller) than the verification yet the verification consumes 55% of all selects from the notificationuser table. Why is this?
I discovered the issue in some sub-optimal code which firstly retrieves the user by token so I can see if the token is valid and already verified or not, then it does this:
public void VerifyUser(int id)
{
  var notificationUser = _db.NotificationUsers.Single(n => n.Id == id);
  notificationUser.IsVerified = true;
  notificationUser.VerificationDate = DateTime.UtcNow;
  _db.SaveChanges();
}
This is a very typical Entity Framework pattern but it’s inefficient as it first pulls the record from the database with one query (so that now makes two select queries when verifying) then updates the IsVerified and VerificationDate attributes before doing an update with the revised entity. This is a case where simpler would actually be better and I should just be hitting it with an update statement inside an ExecuteSqlCommand. In fact I probably don’t even need to do a select to see if the token is valid first, I could just return a value back out of the update statement indicating whether a row was updated (token exists) or not (token is invalid). Most of the time it frankly won’t even matter, but as you scale those additional queries start to take a toll on the infrastructure.
Another interesting database pattern I saw was this one:
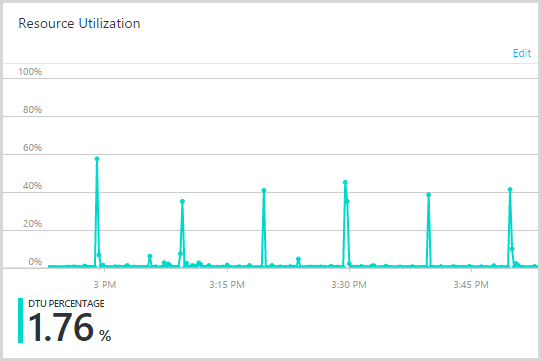
Those peaks were spaced 10 minutes apart so clearly there was a process somewhere causing load on a cyclical basis. At first I wondered if there was an external player somewhere hitting a resource that was hammering the database, then I remembered the verification reminder service… which runs at 10 minute intervals. This is a WebJob that every 10 minutes, goes to the database and checks to see if there is a pending subscription verification that’s at least three days old. As I mentioned earlier, only about 80% of signups actually end up verifying their email address and the remaining 20% get lost in spam filters or accidentally deleted or whatever. The reminder service follows up later with a “Hey, you signed up but never verified” email. Evidently, the query to pull this data was now spiking the DTUs.
My suspicion is that this was happening because it was roughly three days since the original heavy load and due to the massive increase in signups, the queries were pulling much more data from a much larger table. I also found that the table was not particularly well optimised; I was selecting notification user with a query looking at whether they were active, whether they were verified, whether they’d been sent a reminder and if they signed up more than three days ago. I didn’t have an appropriate index for this query and I was grabbing them one by one which isn’t a problem when you’re talking about normal volumes, but evidently is a problem once things get big. Okay, it’s still all a background process so the duration of the reminder process doesn’t directly block responses to the user, but it’s still spiking the database activity which might then adversely impact other queries.
Incidentally, I had really good access to all this information because my Azure portal looks like this:
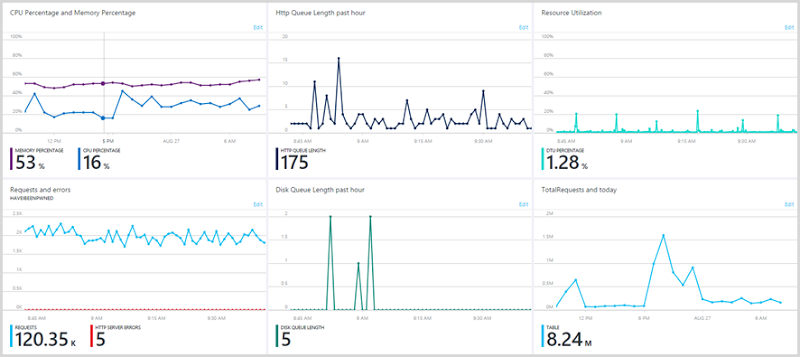
I customised my very own dashboard to ensure that everything I needed was in one place. Check out this post on the Azure portal improvements for some guidance on that and I strongly recommend that anyone else using Azure do the same thing. It’s enormously powerful and really put you in control of what’s going on.
While I’m on dashboards and information, I kept a Chrome window with absolutely everything I needed to monitor the vitals in different tabs:
Google Analytics with the real-time traffic numbers, New Relic with the perf stats, Raygun with errors, Azure with the cloud figures and Mandrill for email delivery. Being able to quickly see what was happening across the app and infrastructure was absolutely invaluable. Speaking of infrastructure…
I’ve written in the past about how I’ve configured Azure to scale web server infrastructure and as you’d expect, I did use quite a few of them over this period:
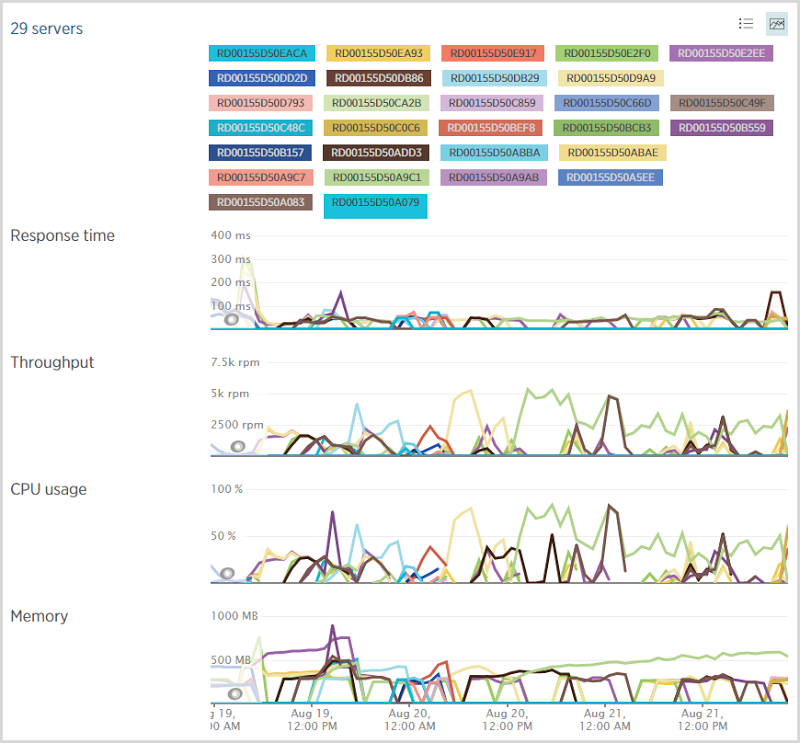
Under normal circumstances I run a medium instance of an Azure website which then scales out to multiple instances as required. Before going to bed on Wednesday night though, I scaled up to a large one and didn’t change it back until Saturday afternoon. This gave me a lot more scope for growth (about double that of a medium instance) and certainly when you look at some of the clusters of servers, it may have been getting a bit tight with medium instances. That said, I’m not entirely sure my scaling thresholds are perfect as it looks like the server count is yo-yo’ing a bit in places. For example, here’s the server count from the Azure portal:
Those peaks are not entirely consistent with traffic volumes and there are a few reasons for this. Firstly, traffic ain’t traffic; different request patterns really change the load. For example, lots of hits to the API stresses different parts of the system to lots of hits to images or CSS. The other thing to remember is that I’ve got a bunch of WebJobs running in the background too. They ramp up independently of traffic to the site and they were working overtime early Thursday morning when you see 10 servers running at the same time. In fact I manually scaled out to 10 to further parallelise the jobs and once I went back to autoscale it settled down around 4 large instances, give or take.
The auto-scale rules I’m presently using look like this:
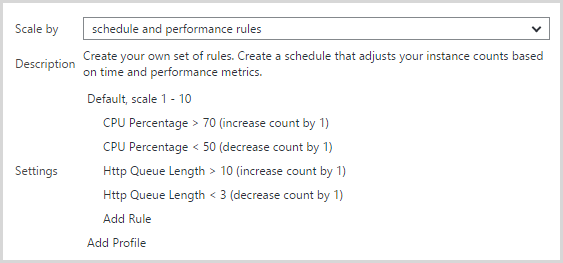
I found that scaling on CPU alone as I originally had it wasn’t scaling up early enough. This was all done many weeks ago as the API was being hit quite frequently and what I noticed was that the one medium instance kept flat-lining at about 8k RPM. I’d manually add another instance and the RPM would go up. What I found was that the load wasn’t causing scale out to occur via CPU but the HTTP queue length was increasing so that became the metric that triggered the scale. I’m now a little suspicious that the queue length measure might be causing scale out then the CPU measure causing scale in soon after thus causing that yo-yo effect. I may reduce the minimum CPU threshold for decreasing instance count to fix that.
This is admittedly quite an aggressive scale profile. I always had more power than I needed and the performance figures above attest to that. All of this, of course, leaves people wondering – how much did it cost me?! Let’s find out!
Here’s everything of relevance from the Azure billing system. I’m going to explain each graph then plot out the costs at market rates. I’ll do it for this billing cycle which is 13 August through to the time of capturing these graphs on the 23rd of August and it spans the crazy period and about a week before that. Keep in mind that these dates are US time so if it’s PST then that’s actually 17 hours behind the other dates I’ve referenced. It doesn’t impact the figures, but you’ll see the timing a little bit off compared to the charts above.
I consumed 424.33 hours of a medium scale app service.
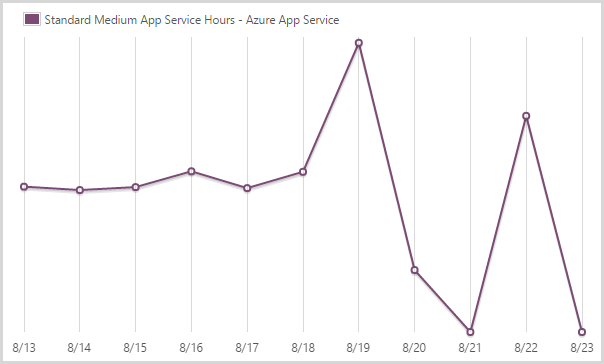
The Azure app service is what you might previously have known as the website service. You can see how it’s pretty steady until the scale out starts to happen. It then goes way down as I resort to only large instances. I go back to medium once the load dies off and the final day in the chart simply doesn’t have any data to register.
I consumed 155.64 hours of a large scale app service.
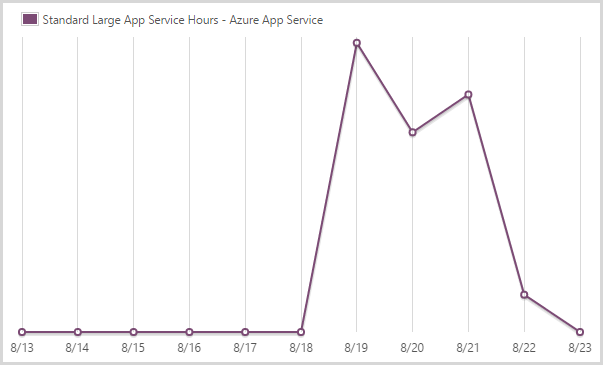
This graph is sort of the inverse of the medium instances because it’s large when it’s not medium and medium when it’s not large and, well, you get the idea. I’m done with large now, unless things go nuts again…
I sent out 16.13GB from the app service in zone 1.
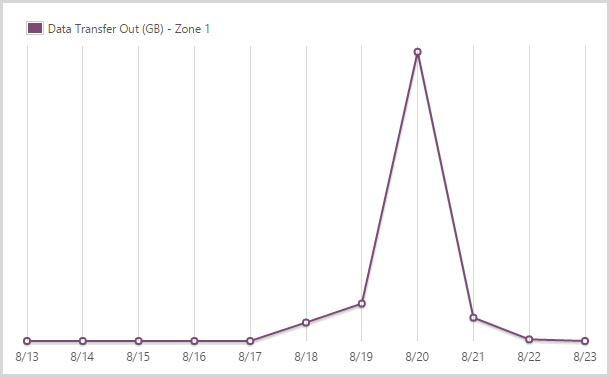
Azure has a tiered egress data charging model which effectively means you pay different amounts depending on where you’re hosting your data. HIBP is in the West US data centre (it’s closest to the most people who use it) and that also happens to be the cheapest. You get the first 5GB free and ingress data (anything sent to the site) is free.
I sent out 122.9GB from the CDN service in zone 1.
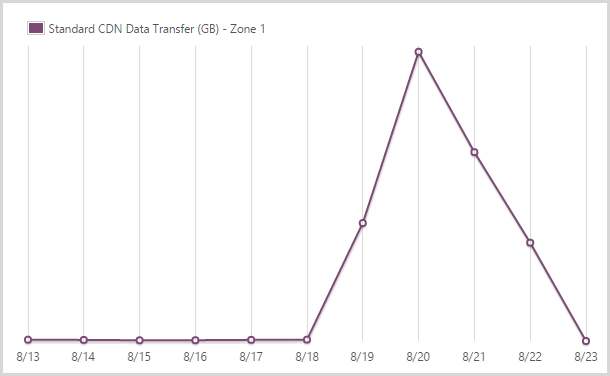
I use the Azure CDN service for hosting the logos of the pwned site. You pay more for the CDN when it comes out of another zone but it’s also faster as it obviously means distributing the content across the globe. I’m happy to pay for that – I optimise the bejesus out of everything that goes in there and it makes things a heap faster so IMHO, it’s worthwhile.
I sent out 9.99GB from the CDN service in zone 2.
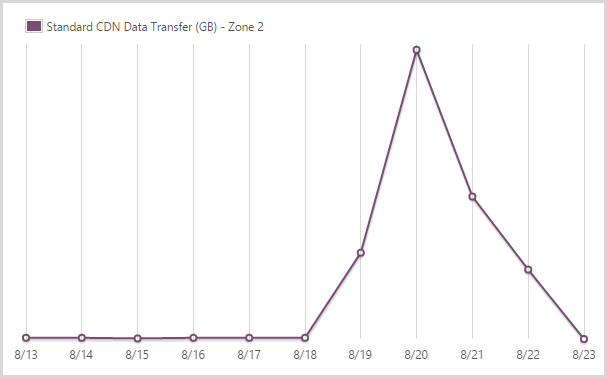
And this is the other zone – it’s a 59% price markup on zone 1 but obviously Microsoft gets hit with different data costs in different locations so that’s fair enough. The figure is much smaller because the traffic was very predominantly driven by US audiences.
I stored 39.62GB in geo redundant table and queue storage.
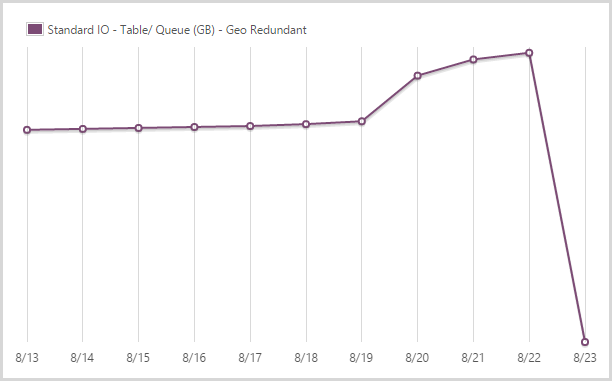
I’ve written extensively about my love of table storage in the past and it performed fantastically during this period. I store all the data that is searched when people hit the site in table storage plus things like my CSP violation reports as well. Queue storage is then used extensively for other processes, particularly in conjunction with the WebJobs. I pay extra for geo redundant storage so that I have a copy in another location should there be a Godzilla event.
I committed 241,702,400 storage transactions.
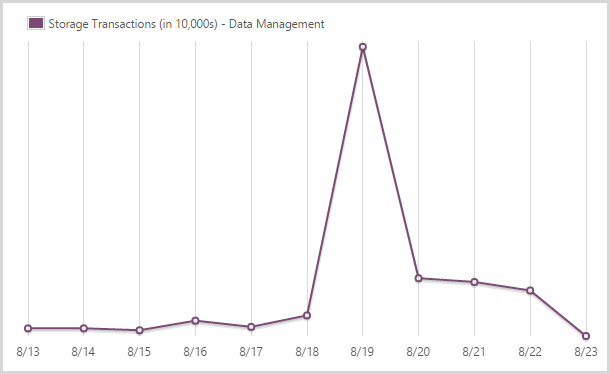
Yes – nearly a quarter of a billion! You also pay for transactions in table storage. There’s a massive spike here as I loaded the Ashley Madison data because the process can result in multiple hits for a single record (i.e. it already exists so I have to pull it, update it then put it back in).
I used 43.96 days of a standard S0 SQL database.
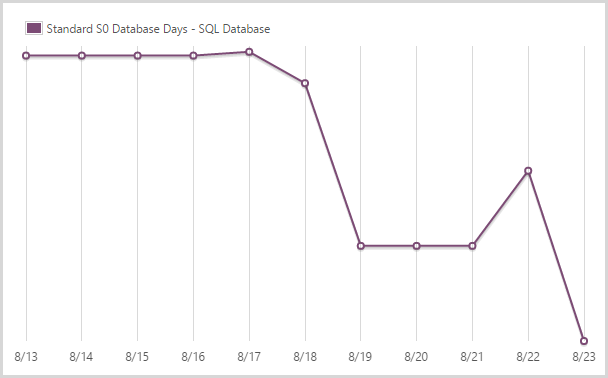
This is the level the SQL database service normally runs at which is your entry level standard database as a service. It’s actually not a fair graph because I have other S0 databases on the account too, not just the one behind HIBP. That’ll inflate the figures a bit, but not by too much. Note how the graph drops off pretty quickly – I scaled the DB up when I loaded the Ashley Madison data because it gets maxed out for a period during the load period (I still use an RDBMS during the load of the data).
I used 1.92 days of a standard S1 SQL database.
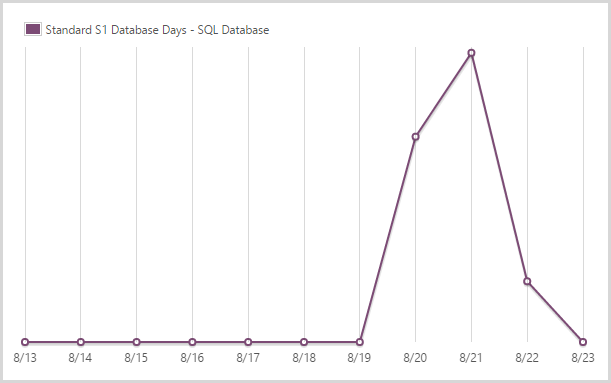
After the initial crazy period and once I saw the DTUs pretty much flat-lining (SQL is only regularly hit when someone subscribes for notifications), I scaled back to an S1. This is only 20% of the DTUs of the S3 you’ll see in the next graph, but with next to no load it was clear I could back it way off, I just left a little bit of insurance by not going all the way back to S0.
I used 1.46 days of a standard S3 SQL database.
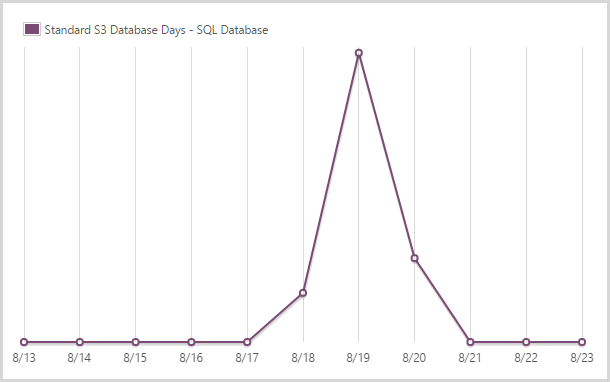
And here’s the spike that fills the gap in amidst the S0 and S1 DBs.
So what do you reckon this all cost me? How far out of pocket did this exercise leave me? I’ll be honest and say that during the event, it was all “scale first and ask questions later” and I did have just an inkling of an uncomfortable feeling that I was going to turn around and see $1k or more of costs, particularly running large instances that would scale out to 10 machines. How would I explain away my long held position of paying less for Azure than what I do for coffee?!
So here it is – the whole set of costs:
|
Service |
Units |
Cost per unit |
Total |
|
Standard medium app service (hours) |
424.22 |
$0.15 |
$63.63 |
|
Standard large app service (hours) |
155.64 |
$0.30 |
$46.69 |
|
App service data transfer out, zone 1 (GB) |
16.13 |
$0.087 |
$1.40 |
|
CDN service data transfer out, zone 1 (GB) |
122.90 |
$0.087 |
$10.69 |
|
CDN service data transfer out, zone 2 (GB) |
9.99 |
$0.138 |
$1.38 |
|
Geo redundant table and queue storage (GB) |
39.62 |
$0.095 |
$3.76 |
|
Storage transactions (per 10,000) |
2,417.024 |
$0.0036 |
$8.70 |
|
Standard S0 SQL database (days) |
43.96 |
$0.4848 |
$21.31 |
|
Standard S1 SQL database (days) |
1.92 |
$2.4192 |
$4.64 |
|
Standard S2 SQL database (days) |
1.46 |
$4.8384 |
$7.06 |
|
$169.29 |
Except the Ashley Madison event didn’t cost me that much because the figure includes all the services I would have normally been paying for over the 10 day period the billing covers anyway. Truth be told, the entire episode cost me about $130 for Azure to serve 3M pages to 1.5M users. Actually, because I’m aiming for full transparency, there were also some costs from Mandrill for sending rather a large number of emails:
With 12k monthly sends for free, I usually don’t go into paid territory. When I do though, it’s a whole 20c per thousand emails and my account automatically tops up after every $5 of spend so I got three bills from Mandrill for a grand total of $15! So probably about $145 all up.
Let me just leave you with one more thing: here’s the stats for the full week, so this is Monday 17 through Sunday 23 inclusive:
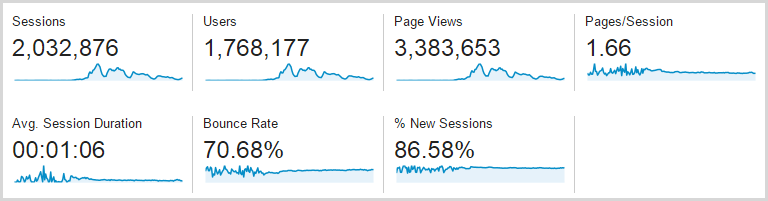
That’s a lot – well over 3 million page views – but of course the devil is in the detail and it comes back to that first graph which shows how intensive the traffic was around Thursday onwards. The real story is that this is a four day traffic spread because the first three days were almost flat, comparatively speaking. Oh – and as per the earlier comment, it’s Google Analytics so what another 20% on top of that and you’re looking at 4 million page views over three days.
But here’s what I really want to show and how I want to end the analysis: the uptime:
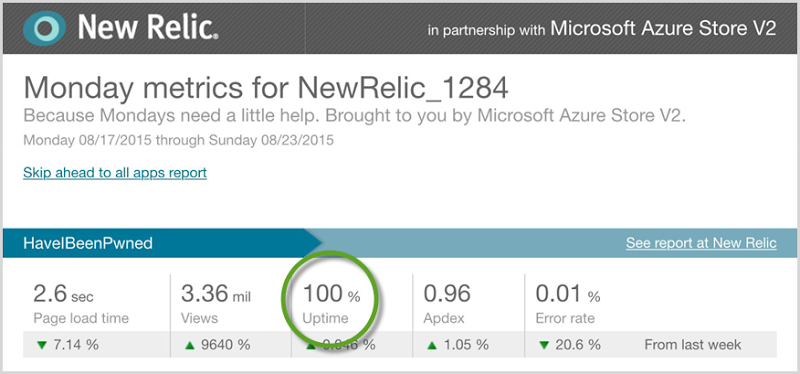
I always like to strive to improve things, but the uptime is one attribute I won’t ever be exceeding :) Over those three crazy days, HIBP on Azure served 4M page views to up to 10k simultaneous users querying 220M records at an average of 41ms whilst costing me $130 for 100.00% uptime!
A totally tangential story for a moment: this all blew up while I was on a snow holiday with my family:

Now there was no way I was going to miss out on any snow time so each time my son and I got back on the chairlift, I’d whip out the iPhone and fire up an RDP session to the VM I use to manage everything from:

How freakin’ awesome is this: I’m riding up the mountain on the other side of the world whilst tuning the scale of virtual infrastructure supporting millions of visitors searching across hundreds of millions of records. If only lift tickets were as cheap as running large scale web applications on Azure…