
Almost without exception, every week I will have one if not both of the following two discussions:
Discussion 1: Illusory superiority of website scale
The whole idea of illusory superiority is that people get around overestimating positive attributes as compared to the norm. How well they drive, how good looking they are and how popular their website will be. By extension, the fact that their website is so awesome naturally means that they will need power. Heaps of power.
Specifically, the discussion usually comes down to how their website need 4 cores and 24GB of RAM and other fancy bits they saw on a PowerPoint deck or read about in CIO mag. Often the recommendation of the aforementioned scale will come from vendors whose approach to capacity planning can best be described as “How much money ya got?”
I rarely see pragmatic approaches to real capacity planning, you know, the kind that’s done with science. In a modern cloud world you can kinda get away with insufficient capacity planning to a degree as it’s easy to scale up or down or out, although of course that also has a pricing impact that most people like to have a sense of up front.
Ultimately though the point I want to make is this: people don’t appreciate just how far modern web servers can scale. Of course this is also predicated on there being well-designed apps, but particularly a modern incarnation of IIS running on Azure can scale a hell of a long way and that’s what I’m going to show you here today.
Discussion 2: Can the “Have I been pwned?” API support our scale?
This is a very well intentioned question and I get it all the time as people jump on board the free API for HIBP. (Remember, this is my little project that enables you to search for your email address across various breaches where data was dumped publicly.) They’re worried that if they enumerate through tens or hundreds of thousands of accounts that the thing will start puffing smoke or begin somehow adversely impacting other users. No, it won’t, not by a long shot!
Of course it’s an understandable question, after all I’m now supporting queries against 163M records and that must be a pretty resource intensive process, right? As I’ve said before, these queries are executing in as little as only 4ms so actually no, in fact it’s an extremely efficient process. Plus the response size is tiny – only 964 bytes when I search for my email address and that includes the response header which is a third of that. I could get that down even further but at that size the vast majority of the time goes in network latency rather than response size anyway.
Yes, I pay for those responses but consider this: for that response size, if I was to pay as much for Azure bandwidth as what I do to buy 2 coffees each day I could support 76,141,871 queries. That’s right – over 76 million queries. Per day. And that’s if all of them return a result – if an account hasn’t been pwned then HIBP just responds with a 404 which is only 225 bytes so less than a quarter of the size.
Let’s see just how far we can push an Azure website searching through a pretty freakin’ big set of data.
Establishing typical search patterns
Ultimately what I want to do in this exercise is establish just how far this service can scale and to do that I need to try and accurately replicate the behaviour of users on the site. Now I could go down the path of replicating behaviour in the browser, but frankly that’s not what’s going to overwhelm the site, rather it will more likely be the scenario I mentioned before – massive usage of the API. Besides, this is by far a more intensive process than simply loading a web page that has no server side processing going on, let’s push the sucker!
There are two primary routes a search for a pwned account is going to go down and then a couple of variations within those. Here’s what it looks like:
- The account searched for is not found:
- The Azure Table Storage partition doesn’t exist – this is named after the domain of the email address so [random value]@gmail.com will always find the partition but john@[random value.com] never will.
- The partition exists but the row doesn’t – this is your [random value]@gmail.com scenario
- The account searched for is found:
- The number of sites the account has been compromised across impacts the response size and consequently the required bandwidth.
I know that about 70% of searches return no result. I know this not because of any explicit logging, but because Azure Table Storage reports on the percentage of successful searches. What I can only speculate on is the spread between 1a and 1b, so I’ve gone with the assumption that 80% of results that aren’t found are still email addresses on a domain I’ve seen before, that is there’s a partition with that name.
When an account is found, the vast majority of the time it will have been compromised on a single site. It’s just simple maths – there are 163M records in the system and 152M of them came from Adobe! Even if every subsequent breach included an account already in Adobe (and it’s usually only about a 10% – 20% crossover), only about 1 in 14 searches that returns a result is going to have more than one record.
All told, here’s how search results are spread:
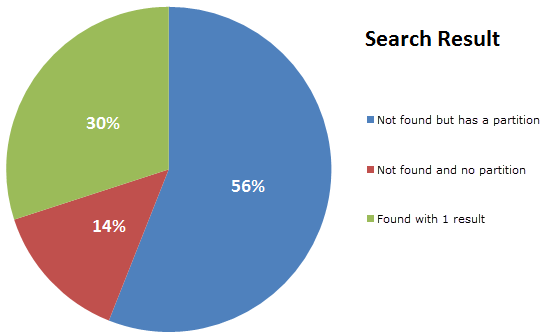
So I built a little API and randomised the account being queried to replicate that spread; 56% of results would search the gmail.com partition for an invalid email alias (a new GUID will do that), 14% will search a partition that doesn’t exist (another GUID, thank you very much) and then 30% will search for an email address that actually exists in a partition I seeded with dummy data. Just to be sure Azure Table Storage doesn’t have a chance to optimise subsequent queries for the same data, the account is randomised within a range of values I preloaded into the partition.
So that’s the search process ready to roll, before I start hammering it though, I want to set up Azure to perform some magic and scale when it needs to.
Configuring Azure website autoscale
I want to see how far I can push that single instance of an Azure website, that’s the first thing, but I also want to see how the system dynamically responds to load and when necessary, scales out. Remember infrastructure typically scales in two ways – “up” (more power in the existing assets) and out (more instances of the same asset). I talk more about these in my post on The World’s Greatest Azure Demo so check that out if you want details.
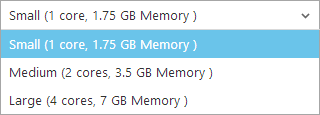
So over to the Azure Portal and I’m going to use the new one, that is the one that’s still in beta at the time of writing. I’m using this one because it gives you more control over how scale happens. The first thing I’ll point out here is that I’m running on the smallest possible VM instance of a standard website:
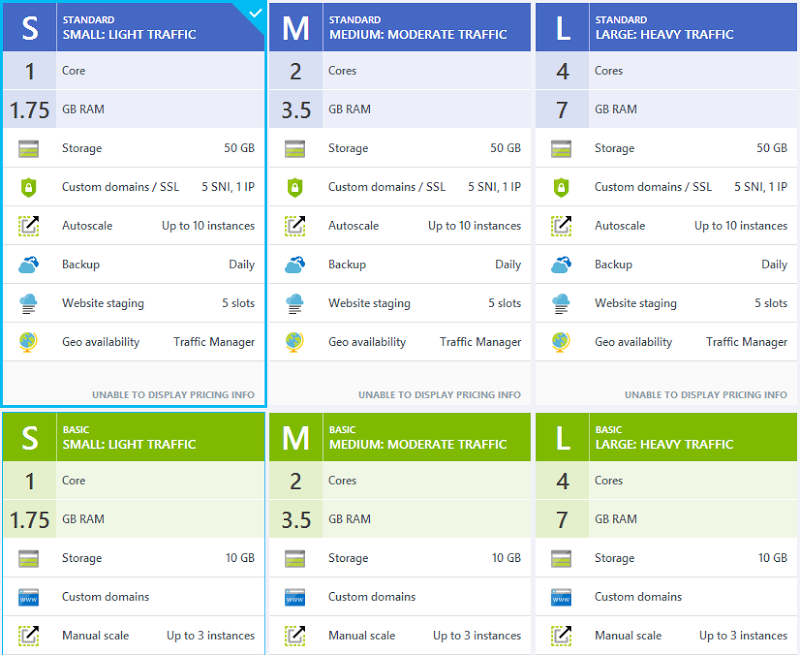
That’s all I need for this particular site and as you’ll see soon, we can push that a long way – “Light traffic” is a very relative term! Moving on to autoscale, there are a few configurations I want to change so that the site can respond quickly to the expected demand and the first thing I’m going to do is set the instance range between 1 and 5 and the target CPU utilisation between 40% and 60%:
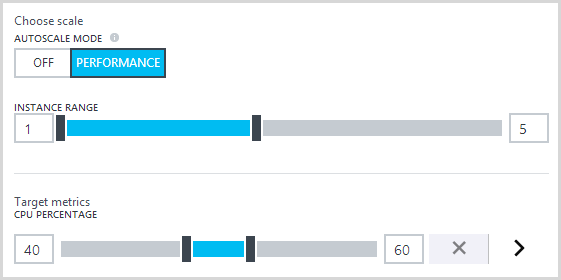
What this means is that once the average CPU goes over 60% I’ll get a new instance of the website then once the average drops below 40%, one will be taken away (average in emphasis as there may be more than one instance of the machine it runs on). I’ll never have more than 5 instances or less than 1 (ok, that one’s obvious but some people will always want to have at least, say, 2 instances).
That’s the easy bit and we could do that with the old portal before anyway, let’s now hit that little right arrow next to the target CPU and play with some of the new configuration attributes:
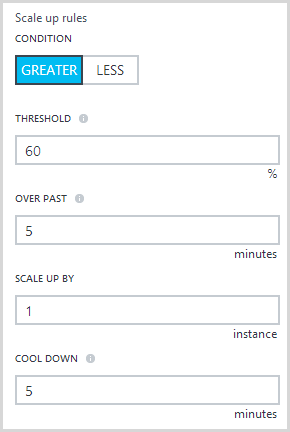
The main newness here is that we can define the duration over which the scale out condition applies or in other words, how long does the CPU need to be sitting above 60% for before another instance is added. When a scale out does occur, it’s going to add one instance at a time and I’ve set a “cool down” period which in this case means that it won’t scale again any sooner than 5 minutes after the previous autoscale occurred.
Scaling back down again is effectively the same thing in reverse:
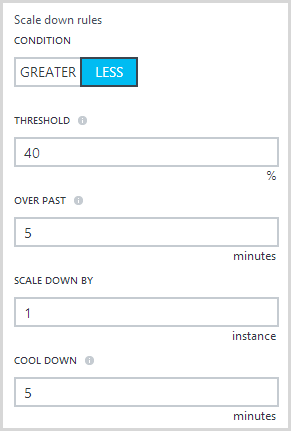
In other scenarios, you might elect to back off a little slower just in case whatever event it was that caused the load hadn’t completely passed.
I won’t change anything further for the purposes of this test, but one point worth noting is that you can now add metrics other than just CPU that can be monitored and automatically trigger scale:
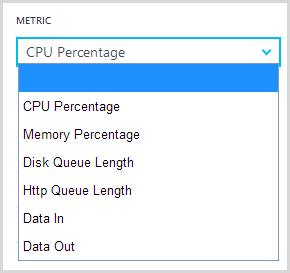
This is neat insofar as you can tailor autoscale to the needs of your particular app based on the behaviours that might typically require more resources and that won’t always be just the CPU utilisation.
So that’s it, we’re set to scale to some pretty serious numbers, let’s now go and set up the test with loader.io.
Configuring loader.io for some serious volume!
There are a bunch of load testing tools out there these days and with “the cloud” being what it is in modern incarnations, it’s never been easier to throw huge volumes at websites to see what breaks first! I chose to use loader.io for a few reasons; firstly, they’re already in the Azure portal as an add-on so it’s dead easy to take it with a couple of clicks and not muck around with creating accounts or handing over more financial info.
Secondly, it’s easy. There are other services out these that can do amazingly complex things and whilst impressive, for such a simple test they actually create a barrier to entry. I wanted point-and-click magic and loader.io gives you just that.
Thirdly, I’ve had great support from them. I contacted the guys there and asked if they’d like to assist me with this post and got nothing but awesome help with a smile :) In fact what I asked for was scale beyond what I could get on their existing plans to help me put this post together and they were extremely accommodating. I always make sure I disclose this sort of “special” support in my posts and it was only after I used the free service and loved it that I pinged them.
Moving on, what I did to get up and running with loader.io was to start out with the add-on in the Azure portal:
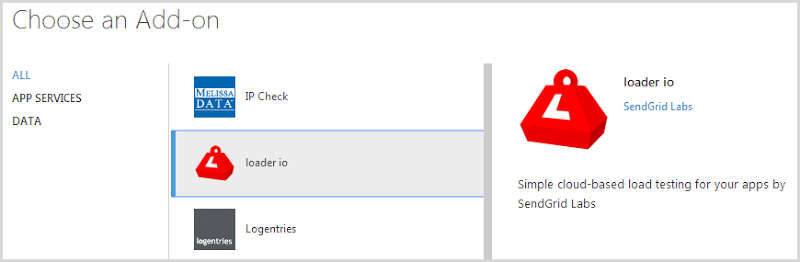
You’ll note that this is provided by SendGrid Labs, you know, the guys who do the email service that’s also an Azure add-on and gets you 25,000 free emails a month. (Incidentally, if you think paying for email rather than using your host’s free SMTP service sounds a bit rich, go and see how many of those emails actually reach the recipient. See? Exactly!)
We’ll grab that add-on and take the free plan:
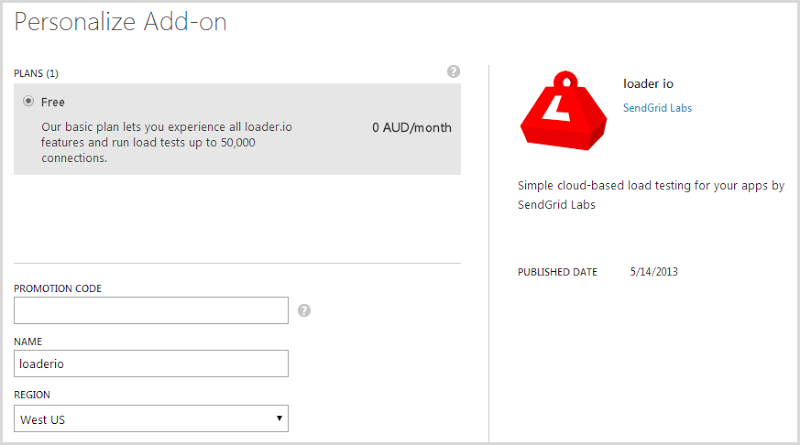
By default, you’ll get 10,000 clients on the free plan and if you socialise the service and get other people to sign up, you’ll get another 5,000 clients each time all the way up to 50k. The real bottleneck on the freebie plan though is duration – you’re limited to a one minute test. This will be fine in many cases and hey, it is free, but in my scenario I needed more time so that I could show Azure scaling and this is why I reached out to loader.io for support.
Right, now I’ve got a load test service!
That bit about starting with a small number of concurrent users? Yeah, pay attention to that! More on that a bit later…
Now I’ll be honest – I did a bunch of trial and error in order to figure out the values I’m about to show you next. As you’ll read later, I also did a bit of damage to my availability stats in the process of figuring out the right balance of scale, duration, site responsiveness and also the opportunity for Azure autoscale to kick in. Let me walk you through the loader.io setup process with the scale I eventually used and it’s all contained in this one screen:
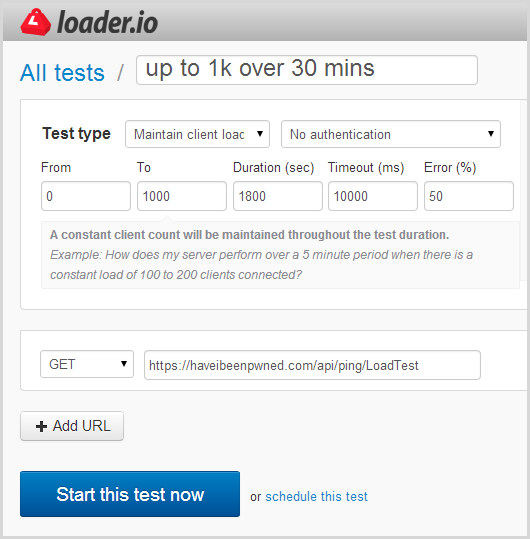
There are several test types available including a set number of clients per test, a set number per second and the option I’ve chosen above which is to maintain client load. You can read more about these in the test types doc, but here’s the lowdown on the option I’ve chosen:
If you really want to hammer your website or API, this test is the way to do it. Loader ensures that a constant number of clients is loading your service at all times. So this test makes as many requests as it can for the amount of time you specify.
This test allows you to specify a from and a to value for clients. If you specify zero and 10,000 here for example, the test will start with 0 clients and increase up to 10,000 simultaneous clients by the end of the test.
tl;dr – this will increasingly load up the system with clients. Based on my config above, it will start from zero then ramp up to 1,000 clients per second over a 30 minute duration. I’ve chosen 30 minutes (again, with support from the loader.io guys), as I want to show Azure scaling at multiple steps along the way.
The URL I’m using can be requested via HTTP GET and that’s the one that’s going to randomly chose one of those three possible search paths based on the real world prevalence of each.
That’s enough of that, let’s start the test!
And now I go grab a coffee while all hell breaks loose on HIBP!
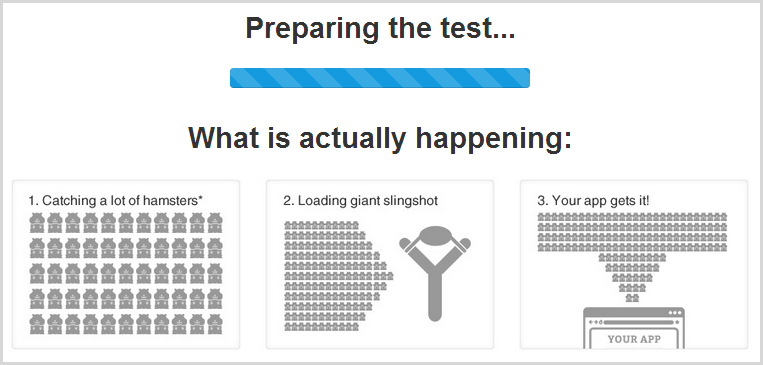
What happens when a load test starts
I’ve configured HIBP to keep me up to date as soon as anything of note happens. For example, I’m using the free Azure alert service to send me an email when it sees more than 2,000 requests within a 5 minute span:
I started this load test exactly on the hour and it was 1 minute and 49 seconds later that the email arrived and I was told about the load (I don’t know how long loader.io took to warm up either). I find this service really useful for when the site suddenly hits the press or someone decides to start hammering the API.
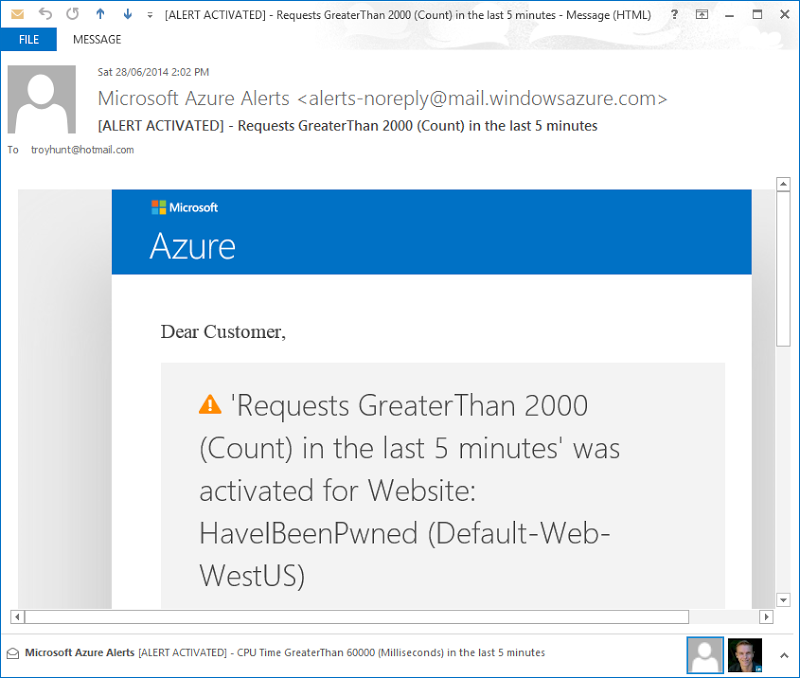
The next thing I knew was that the CPU utilisation was getting high:
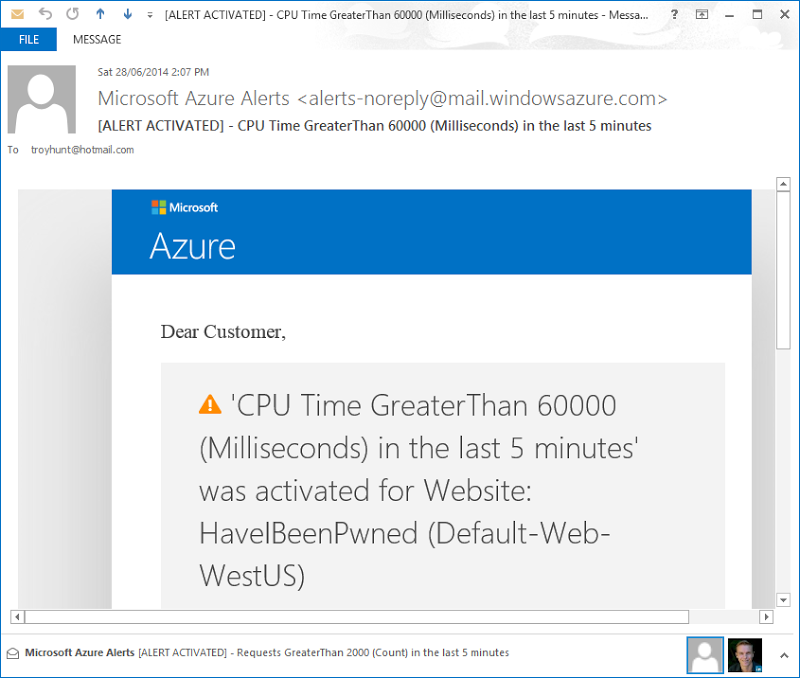
Now we’re 7 minutes into the test and Azure is telling me there’s been more than 60 seconds of CPU time over the last 5 minutes. For a site that usually sits at less than 1% CPU – even under “normal” heavy load – this is significant. It’s enough that when it’s not a load test I’m playing with, it might prompt me to go over to the Azure portal and take a look at what’s going on.
All of this happens quite early in the scope of a 30 minute test, of course what we’re really interested in is how the thing performed under load. Let’s check that out now.
The aftermath
Get ready for this – I hope you like charts! I’m going to screen cap a bunch of them from loader.io but if you want to view the originals, here’s a deep link to the test so that you can go and inspect all the results for yourself.
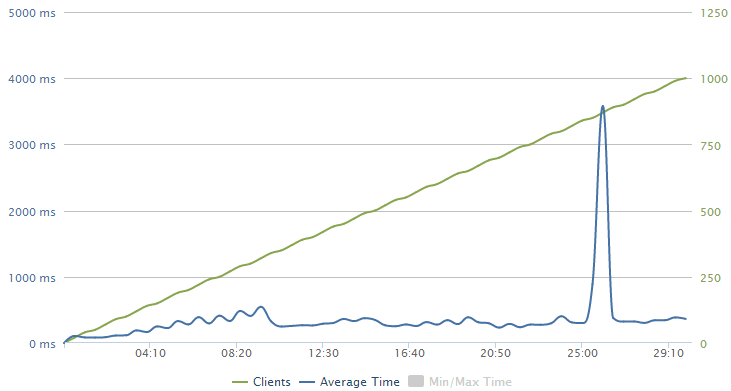
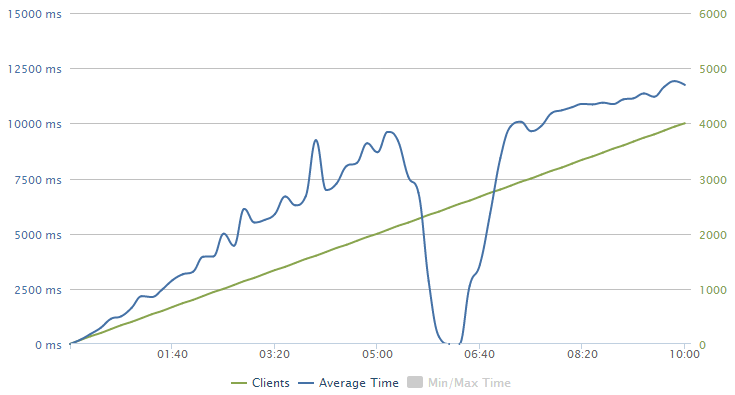
When loader.io wraps up, the first thing you see is a chart like this:
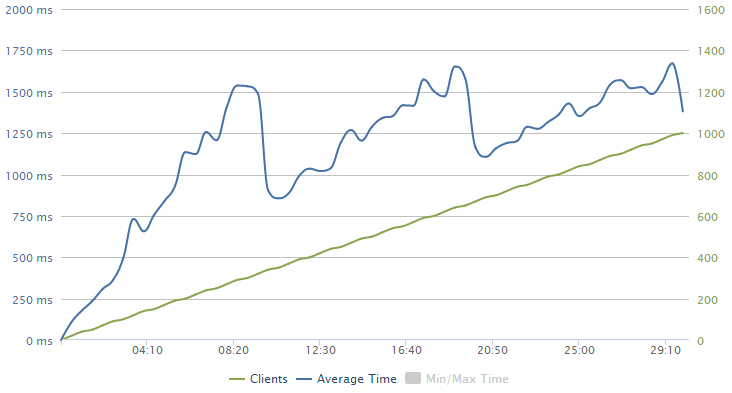
Obviously we’ve got two sets of data plotted here and the very linear set in green is the clients. Remember how I configured the test to ramp up to 1,000 clients per second over a 30 minute period? That’s this guy.
The blue line is the response time and it’s showing a bit of a sawtooth pattern here; it pretty consistently increases before a big drop at around 10 mins, then increases to about 20 mins and drops again then also drops around the 29 minute mark. This is in response to Azure autoscaling and we’ll look at that in more detail in a moment.
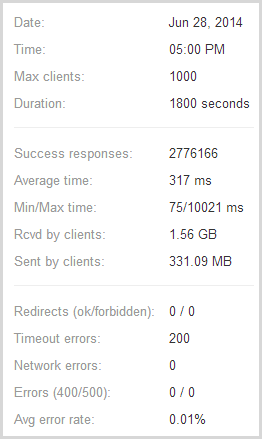
Next to the graph loader.io also presents some raw numbers:
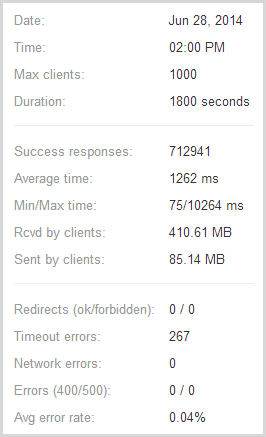
So the important stats – almost 713k successful responses and only 267 timeouts or in other words, only one in every 2,671 requests failed and I reckon that under the circumstances, that’s pretty impressive! The test pulled back 410MB of data with response times ranging from 75ms up to over 10 seconds which incidentally, is the timeout figure I used in the configuration earlier on.
There’s another graph from loader.io that paints a slightly different picture:
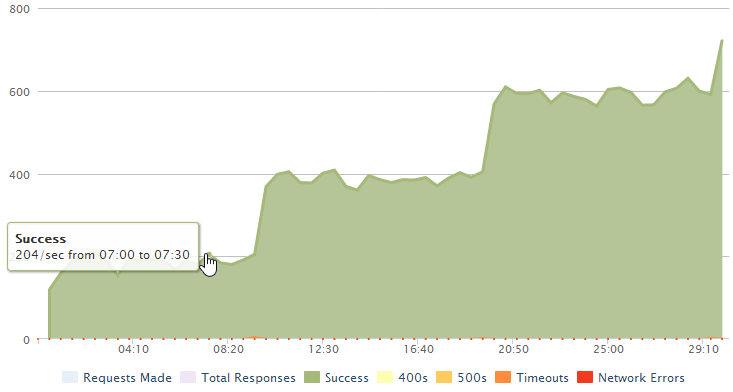
What’s interesting here is the thresholds; we’re hitting about 200 successful requests per second and that’s the max we can achieve until it jumps another 200 at the 10 min mark then jumps another 200 at the 20 min mark and begins to jump again just before the test ends. There are two things we can surmise from this: firstly, each instance of a small Azure website is supporting 200 requests per second. Conversely, one instance of a small Azure website is simply maxing out at 200 requests per second and can’t serve any more even as the load increases. But they’re not failing either (at least not very often), they just get queued.
Secondly, adding website instances is causing the service to scale in a linear fashion so the bottleneck is almost certainly the website’s ability to respond to the volume of requests and not a restriction on the underlying table storage.
Another thing we can pull out of loader.io is bandwidth, both in terms of data sent and data received.
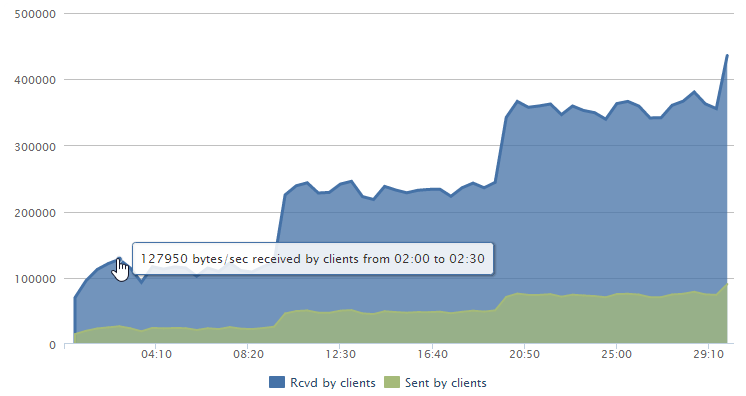
That’s probably not so relevant in this case as it’s only about 125Kb/s down – lots of small requests that require server side processing don’t make for impressive bandwidth stats!
And finally, the distribution of response times:
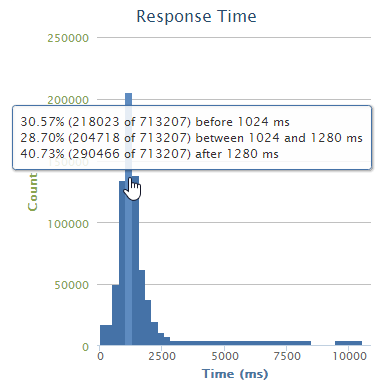
Fairly self-explanatory and as you’d expect, it’s your classic bell chart with the bulk of the requests falling into that one to one and a quarter second timeframe which we also got from the first loader.io chart.
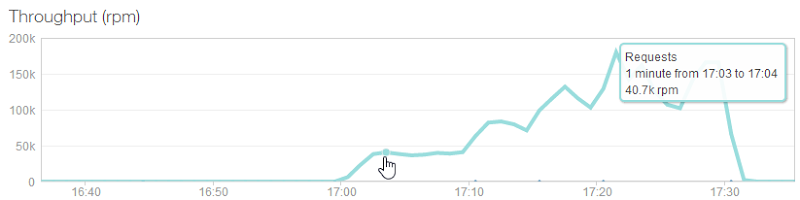
Over on the Azure portal (and I’m back in the classic one this time), the stats pretty much reconcile what we’ve seen from loader.io which is reassuring:
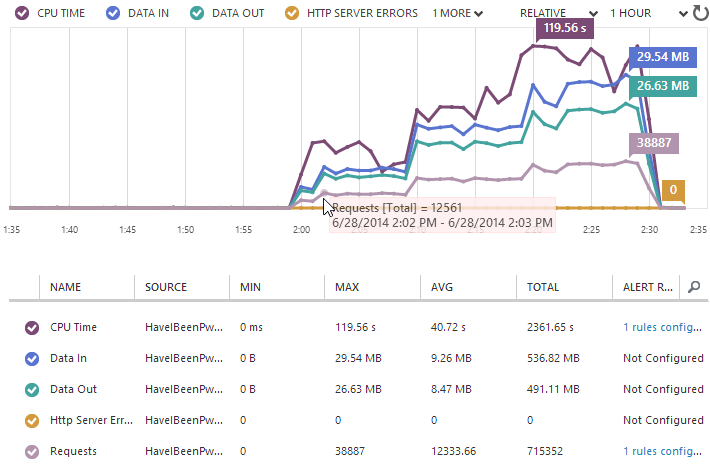
They’re never going to exactly match up, but we can see the same initial ~12k requests per minute (which of course is 200 per second), the same pattern of stepping up at the 10 minute marks and a very similar end result in terms of the total number of requests.
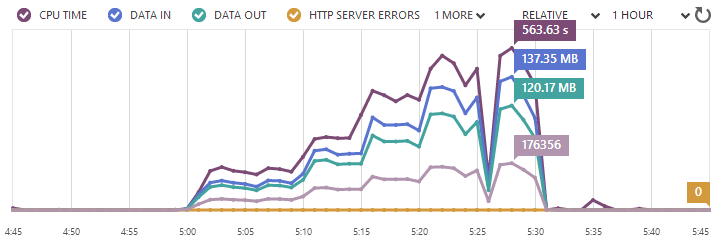
Because I have the free NewRelic service configured in Azure, I can also pull stats from there:
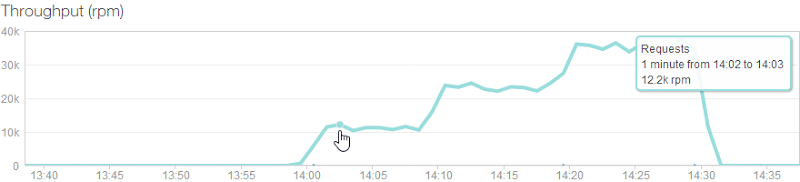
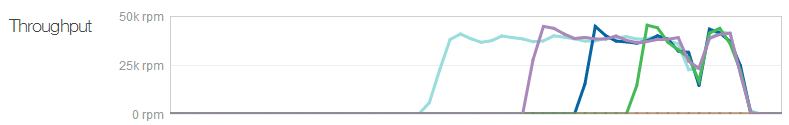
But the other really interesting thing we can get out of NewRelic but not the other sources of data is how individual servers were added over time (each coloured line is a different machine):
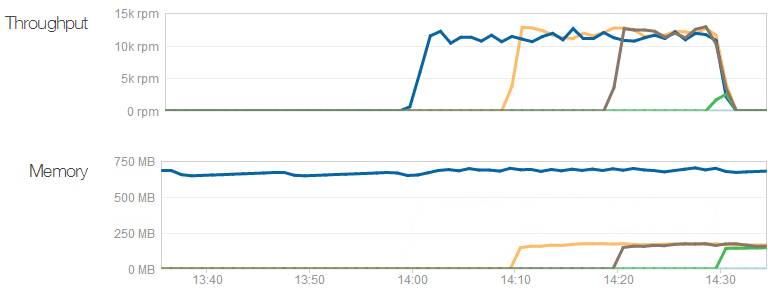
The throughput shows what we already know – that each machine can server around 12k requests per minute – but what I didn’t know is that their memory requirement is actually very low. The first machine with the dark blue line has been running the site for some time (and other sites I have on it, for that matter), but it still sits around the 700MB mark. The three new machines that get put on are all using about 170MB – think about that next time you’re speccing a web server! (Yes, yes, result may vary, do your own testing and so on, point is that IIS can do an awful lot with very little.)
Here’s a question you may be pondering – why is Azure only scaling at the 10 minute mark, didn’t we set it to scale every 5 minutes? I don’t honestly know the exact reason and in fact when I ran the test a couple of days earlier, it scaled at the 6 min 30, 12 min, 16 min and 21 min 30 marks (you can have a look at that test here if you’d like). What I would say though is that this is not an exact science; not only are there multiple variables that go into when scale occurs (namely time and CPU load), but you may find that additional resources aren’t always auto-provisioned with the same efficiency. Create enough VMs in Azure, for example, and you’ll see that there can be quite a bit of difference between the provisioning times.
This test also wasn’t particularly reflective of organic usage, I basically slammed it very hard and very early. Under normal circumstances, load would usually ramp up both more gradually and more erratically and there would be more time for scale to be adjusted. The main takeaway from this though is that scale was indeed automatically increased in response to demand and that it had a significant impact on the throughput of the site.
Turning it up to 11
Earlier on I mentioned that I was running on a “Small” Azure website and that it had a single core and 1.75GB of memory. That’s fine for HIBP and as I also mentioned, it sits there at under 1% CPU utilisation the vast majority of the time. But the scale doesn’t stop there, we can ramp it up further:
This is scaling “up” or in other words, increasing the size of the instance rather than just adding more of them. You can’t autoscale vertically rather you need to manually select from one of the sizes above in the portal. You pay for this too, obviously – “Medium” is exactly double the cost of “Small” and “Large” is double again. So how would this exercise look if I changed the scale to “Large” and repeated the test? Let’s do it!
This is an on-demand change so I can just crank it up in the portal, make it effective immediately, re-run the test then crank it back down. I’ll pay four times as much for the 30 minute test or in other words, about 20c. T-w-e-n-t-y c-e-n-t-s – that is all.
Here’s what happened next (and here again is the link to the source test for the curious):
And the stats:
The RPM according to NewRelic:
And then then throughput showing when servers were added:
Interestingly, the timespan between those three additional servers being added is much closer to the 5 minutes I expected with the last test. As I concluded then, it’s not an exact science and results will inevitably differ a bit, but it’s good to see that those settings could allow Azure to scale at 5 minute intervals if it really wanted to.
You knows what’s probably not just a coincidence? The instance size that costs 4 times as much just pumped through almost four times the volume. We’ve gone from 12k requests per minute per instance to about 40k. The reason why is apparent when you look the average client times – rather than the time rapidly scaling up to over one second in the earlier test, in this one it’s consistently sitting at around the 300ms range. The client is pumping through requests at a much faster rate than what it could before.
Even the total number of requests over the duration of the test (which includes all the scaling) was very close to a fourfold improvement – exactly 3.9 times more requests at almost 2.8 million. There were actually less errors too, and that’s not pro rata, just less full stop inevitably because there was much less queuing and consequently less timeouts.
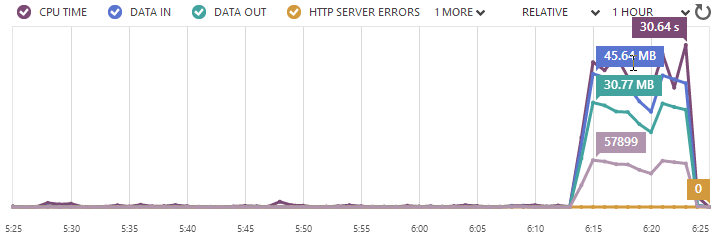
Of course the one oddity is that dip (or spike, depending on which chart you look at) just after the 25 minute mark. The CPU utilisation went down, the response times went up and even the Azure portal showed everything going a bit funny:
I’ve no idea why this is; perhaps it was related to a scaling hiccup, maybe it was maintenance, maybe it was even at loader.io’s end and they simply couldn’t maintain the load. Who knows, but I do know that I only lost 200 requests across the entire test and it was a very momentary spike / dip. I’d normally run this test again to give readers a more predictable picture, but this is more a warts-and-all post and besides, it’s starting to cost a bit more money at this scale!
Hey – you know what would really start to ramp the cost up? Throwing absolutely everything Azure has to offer at it – yeah, let’s do that!
Giving it everything she’s got, capt’n!
By now you know that Azure websites can autoscale in response to demand which is pretty neat. I leave the site with a single instance of the smallest scale and when necessary, magic happens and I get more resources automatically. But you can also just lock it in at a level of your choosing – shall we see what 10 instances of a large machine can do? :)
I’m only going to run this for 10 minutes because not only will this be more than enough to show throughput at a constant load, but it will save me some dollars. No – hang on – 10 large instances running for 10 minutes is only 67 cents of CPU time anyway! Remember, Azure bills you by the minute so mucking around with these sort of tests is frankly as good as free anyway.
Now if I’m going to really hammer this thing and test max throughput, I don’t even care so much about gradually scaling up or making the load something the site can politely deal with, I just want to throw as many hamsters at it as possible. So I told it to go from zero to 20k clients in only 10 minutes.
Here’s what happened next (and here’s the obligatory loader.io test result):
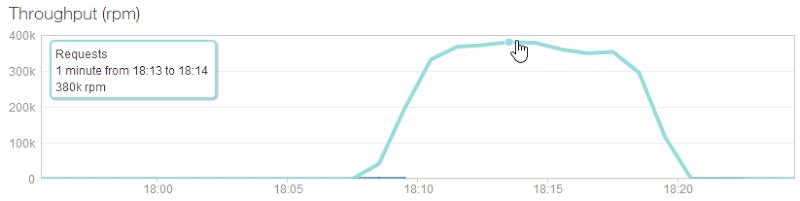
I’m showing the NewRelic report because it’s the requests per minute I’m most interested in. HIBP just served up to 380k requests per minute with each request searching through 163M records. That, IMHO, is massively impressive. Yes, it’s running on a maxed out Azure website configuration but it’s still only costing $4 an hour. The site also served over 3.5M requests and nearly 2GB in 10 minutes, dropping less than 0.01% of requests due to timeouts.
Let’s not lose the significance of this scenario; this is a standard Azure website that I provisioned on demand with as much ease as you would their smallest offering and I created load that is normally unfathomable for this site with just a few clicks thanks to loader.io. “The Cloud” rocks!
On DDoS’ing myself
Yes folks, I DDoS’d myself. That’s right, I threw way more hamsters at it than what it could handle and it took the service completely offline. Bugger. Remember earlier on when loader.io said “Be sure to start with a small number of concurrent users and test over a short period of time until you are confident your server can handle increased loads”? Yeah, turns out that’s kinda like the “don’t pat the lions” sign at the zoo – bad stuff can happen.
I’m sharing this – the fact that I totally screwed it up – because it’s an interesting learning experience. I’m one that tends to see instructions like “start with a small number of concurrent users” as a challenge rather than sage advice and this is what can happen:
I hit about 2,000 clients per second before that single instance of an Azure website running on the smallest possible VM with only a single core and 1.75GB of RAM querying 164 million records gave up. Sure, it was queuing requests and getting towards 10 seconds to respond to the request, but still – 2k clients!
As soon the load test overwhelmed the service, NewRelic was onto me about it via email:
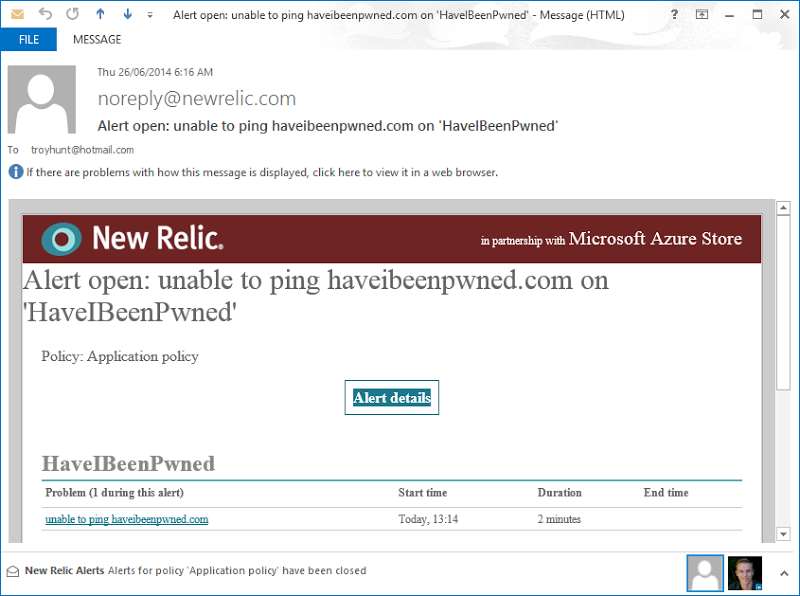
I love this sort of notification as it means that when things break catastrophically to the point that the entire service goes down, there’s an out of band process keeping an eye on things and letting me know about it.
Identifying the bottleneck
In that first test which started out with a single small instance of a small website, I managed about 200 requests per second when searching through those 163M records in table storage. But it begs the question – how high would this go if it wasn’t querying a large data set? Ok, they’re fast queries, but the app still has to sit there creating connections Table Storage, sending a query, waiting for a response then converting it to JSON and finally sending it back down the wire. How much throughput could we achieve, for example, if Azure was simply serving up a small text file from the file system?
Here’s what happened when I ran a test against a 41 byte txt file:
That’s a significant improvement in throughput – call it almost fivefold or approximately 965 requests per second. Remember, that’s a single small instance of an Azure website serving a text file. According to NewRelic, the CPU maxed out at 100% during this test too so I reckon that’s about as far as you can push it.
The point I want to make is that by no means is 200 requests per second a ceiling and indeed there are also cases where you’ll achieve a lot less than that by virtue of the tasks the resource being requested is performing. This would have been a more sensationalist title for this post – nearly 2 million requests per minute if we pro rata this result as scale – but it wouldn’t have been a real world example.
Mitigating factors to support website scale
All the tests I did here were against the API so just single requests (ok, lots of single requests!) to an endpoint returning JSON. As I’ve already said, this is where the sudden scale is most likely to come from due to someone suddenly searching through a large list of accounts, but what happens if the website suddenly hits huge scale? Now you’ve got images and style sheets and a bunch of other resources coming down for each visitor, how does that scale?
Well firstly, the site has hit 100k users a day in the past and still not even autoscaled up from a single small instance. I didn’t even get so much as an automated CPU alert from Azure so that’s barely touching the sides. Besides, on average, that’s only about one user every second and we just saw 200 requests a second on this config so clearly it’s a small drop in the ocean.
Secondly, as I wrote about in Micro optimising web content for unexpected, wild success, I use public CDNs for things like jQuery, Bootstrap and Font Awesome. Regardless of how much load I cop, all of these are served for free by third parties so whilst I still need to serve my own CSS and JavaScript from the site (which of course immediately caches for each user), I don’t need to serve up other libraries which are publicly available.
Then there’s the Azure CDN which I’m now using for all the images on the site. Not only does this put them close to the people requesting them, it takes them off my website so as with the public libraries, this is load I’m not incurring on the site and it’s consequently not eating into the resource pool.
When the world is not enough
So that’s it right – I’m capped to 380k requests a minute? Not quite, that’s just one instance of a website, I can keep on adding instances if I like. A typical scenario would be as Scott Hanselman describes in Cloud Power: How to scale Azure Websites globally with Traffic Manager – he wanted to place additional instances of the website in more geo-convenient locations for his audience and he did this with the help of Azure’s Traffic Manager.
In a scenario like this, you could scale out to additional data centres with each one then running multiple instances underneath; how about 10 large instances in the West US then another 10 in the East US? Max them all out and we’re getting over three quarter of a million queries a minute. I could also use Read Only Geo Redundant Storage to replicate the Azure Table Storage to the other side of the continent so it could still be read locally. Because I auto-deploy from GitHub after pushing code, the development and deployment experience wouldn’t even change. Easy!
As well as simply replicating the site as it stands, I could also very easily split the browser-centric assets from the API. At present, it’s just one website serving both HTML and API requests. It would be trivial to stand up another website on its own logical VM and serve the API from there off another domain. Of course the efficacy of that depends on where the load is coming from, but assuming a whack of it comes via browser requests this would make sense. Regardless, it provides another means of segmenting load and configuring the resources differently for direct API requests and browser requests for HTML and CSS content.
There are a number of ways that even that huge number I achieved above could be pushed further – multiple times further – and it’s all configurable on demand in the portal. It really is that easy.
Because “The Cloud” is just awesome
You know what I really love about this exercise? All the times I’ve seen all the speculation and all the guesswork about scale – what an app needs, what it will do under load, what infrastructure is required – goes out the window when you have a service like Azure combined with loader.io. You don’t “guess”, you “do”. I threw more load at this thing than what I’ll probably ever organically see on HIBP because I wanted to see what happened, and it barely even touched the sides of my daily coffee budget to do it.
The thing that strikes me most about this test is that now I know where the ceiling for this system is – about 400k requests per minute without even touching any code. I also know that I can go from the current web host plan that’s costing me $74 a month to supporting 24 million requests an hour and I can flick that switch in less than a minute.
Let me wrap this up by going back to the two discussions I opened with:
Discussion 1: Illusory superiority of website scale
A website running on the smallest possible instance of an Azure website can be pushed very far. Those 200 requests per second weren’t exactly sitting around smoking cigars, they were working against 163M records. Of course results will always differ and there are plenty of things we do in web apps that will legitimately work the system harder, but that gives you a good sense of the scale potential.
Discussion 2: Can the “Have I been pwned?” API support our scale?
Yes, it will support more scale than you can consume and if it can’t, I’m gonna cash the service in because it clearly represents a lot of value to someone if they genuinely want to hammer it that hard :)