I’ve had a lot of conversations with folks recently about web app performance. Often these conversations have been around the assertion that a content distribution network (here forth referred to as a CDN), is something you need to deploy early on in the optimisation process of a website. Personally, I see a CDN as a last resort; it’s what you turn to when all other performance tuning alternatives have been exhausted and you need to eke out that last little bit of latency by moving the content closer to the audience. It’s not a replacement for good website optimisation, it’s an enhancement.
One of the main problems with a CDN is simply this: people still have crap connections. It doesn’t matter if I can put the content in the same city as the audience, if they’re in a location where “broadband” is a 1Mb connection or even if they’ve got a super-fast service but the 3 kids are all simultaneously downloading torrents, you’ve got a problem. How well optimised the site is now matters a lot more than how close the content is to you.
The point I’m making is this: well optimised content is king. If you can get that video down from 2Mb/s to 500Kb/s (sounds like a lot but I frequently see this sort of scenario), or dramatically slash the number of HTTP requests and the content size on a web page, you’re going to reap those benefits under any circumstances. This is where you have to start; get this right first because it’s the fastest, cheapest way to add performance.
So it got me thinking: how much improvement can be made on an already well-optimised site, I mean one that scores very well against existing performance yardsticks? How much faster can you go without spending dollars on a CDN? Turns out there are big gains to be made very quickly – and it costs just a tiny bit of development time.
Establishing a baseline
This isn’t one of those “Hey, look at this dismally performing, poorly optimised sites and how much better I just made it” posts. No, this is about taking a well optimised site and making it, well, more optimised.
Earlier this week I launched ASafaWeb, an ASP.NET MVC 3 app for dynamic analysis of configuration related security vulnerabilities in .NET websites. I’ve got a pretty good idea of what it takes to make a website fast and from day one I was able to apply the fundamentals, so much so that YSlow already gave the site a great big green “A” without even trying:
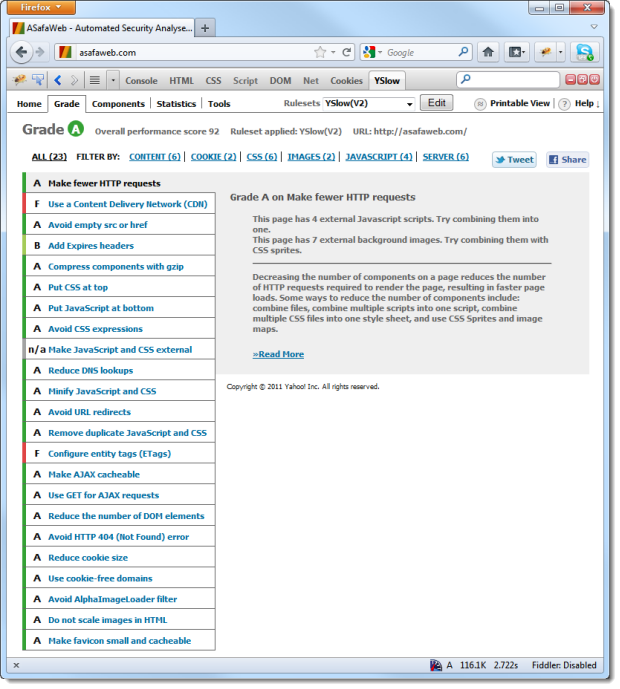
This in itself was a very pleasing result, especially given I often get involved in looking at poor performing sites and they come straight out of the box with a B, C or even D rating (those 19 separate .js requests didn’t help). But this doesn’t make it perfect, not by a long shot. In fact there is significant gain to be made on top of this. But before we get into that, let’s establish a baseline.
Here’s what’s happening on the front page:

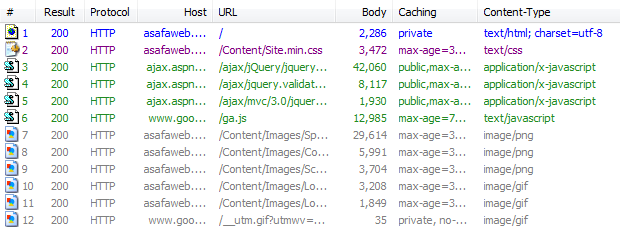
And according to Fiddler, here’s how it’s all being loaded up:
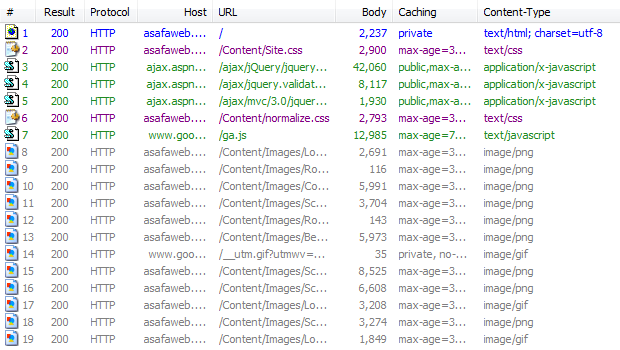
There are few things worth noting here:
- Everything other than the images is already using HTTP compression (the bitmaps are already well optimised). Whilst that first response shows a body of 2,237 bytes, it’s actually more than double that in the raw (5,237).
- Requests 3, 4 and 5 all come from the Microsoft CDN and serve jQuery files (also compressed).
- Requests 7 and 14 are Google Analytics.
To understand what this looks like in terms of the sequence of requests and the dependencies, here’s the timeline:
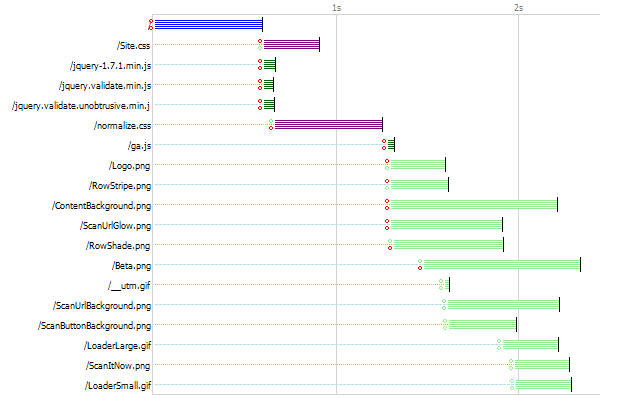
What’s a bit interesting with this is that the Site.css file – which is 2,900 bytes – takes about six times longer to load than the first jQuery file which is 15 times larger. This is the power of the CDN and without debunking my own assertion in the opening paragraph of this post; a CDN can be greatly beneficial at the right time. Let’s exhaust all those other optimisation avenues first.
Now my results are not going to be the same as everyone else’s. I’m in Sydney and hosting ASafaWeb on AppHarbor which places content in the US rather than Australia. This gives some insight into the massive performance difference between the ASafaWeb requests and those from the Microsoft CDN (which I assume by the figures, has a local presence).
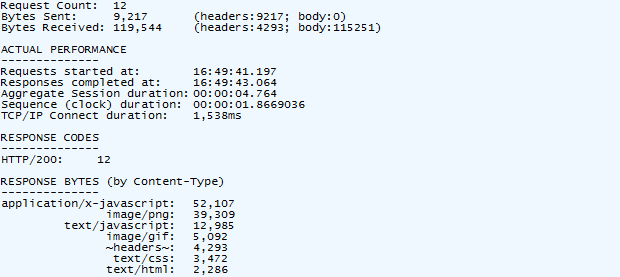
In summary, it all means this:
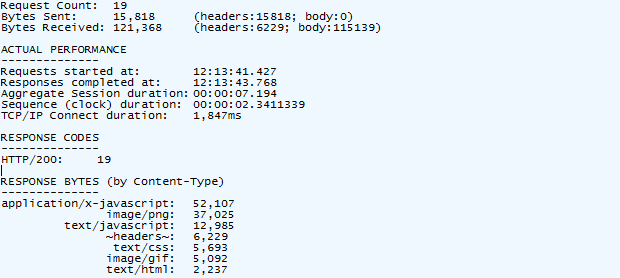
The important bit above is the sequence duration; the page is loading fully in 2.34 seconds. Load it again and there’ll be a different result but my connection is stable enough to give a pretty good level of consistency. It’s this duration which we want to get down.
One more thing: all of this was done with Chrome. Other browsers may sequence requests slightly differently or support a different number of simultaneous connections. Regardless, the optimisations to come will benefit all browsers. A lot.
Going beyond the basics
There are four things I’m going to do which combined, will make a significant difference to how ASafaWeb performs:
- Reduce the number of HTTP requests. Every request sends additional bytes in the request header, receives additional bytes in the response header and requires another TCP connection which incurs the wrath of network latency. Furthermore, it prohibits the browser from making another request if it has reached the maximum simultaneous connections it can hold open.
- Reduce the content size. I can do this by minimising the CSS and JavaScript files.
- Use a data URI scheme. In short, place some binary data inline in the CSS rather than making a separate image request. This helps us with point 1.
- Use an image sprite. This places multiple bitmaps in the one image and uses CSS to chop them up and position them. Again, it helps with point 1.
Now that I’ve said all that, I’m not going to approach it in quite that order. I’m going to start out creating the sprite simply because it helps us with several of the objectives above. I started out by looking at the ASP.NET Sprite & Image Optimisation Framework. In theory, this sounds good. In practice, I was a bit underwhelmed.
Basically, the idea is that you pull the framework in from NuGet, whack your images in the newly created “App_Sprite” folder then reference the newly created CSS file and individual images via some funky Razor syntax. All good in theory.
But the problems I had were numerous and more because I wanted very precise control than anything else. Firstly, the default model is to generate a high compatibility CSS file which uses the data URI scheme (i.e. big file with lots of inline binary data and support limited to more recent browsers), and a low compatibility file which just uses your classic sprites (very broad compatibility). Problem is, I wanted a bit of both.
The problem begins with repeating background images. Sprites work on the concept of explicitly choosing a position in the image then chopping it X pixels wide and Y pixels high. You can’t then take this slice and repeat it in a given direction unless the entire sprite is exactly the same dimension as the direction you’re repeating it in. For example, if you have a bunch of horizontally repeating background, you can make it 1px wide and stack them on top of each other. However, throw in anything wider and you’re flat out of luck unless you stretch it to the width of the entire sprite. And you’re stuck if you want one of them to repeat vertically.
ASafaWeb has two horizontally repeating images; one does the shade under the navigation bar and the other does the striped line:

They’re both 1 pixel wide (no need for any more), and 8 and 3 pixels high respectively. It also has a 1 by 1 pixel semi-transparent PNG which repeats in both directions (sometimes the element it’s in has a border which I don't want transparency applied so CSS transparency is out):

They’re all tiny and they’re all unsuitable for inclusion in a sprite together, particularly once you add other images.
Speaking of which, there are 5 other images which appear as either classic <img> tags on the page or as backgrounds on other elements via CSS. The aforementioned sprite and image optimisation framework works just fine for the image tags, but it doesn’t help you with the background images in your CSS, at least not automatically.
But the thing that really bugged me is this:
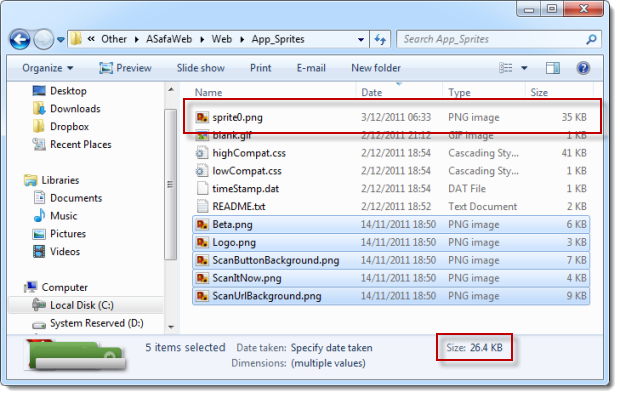
What you see here are the five images I do want to create a sprite from. They’re highlighted and show a total size of 26.4KB. Now look at the “sprite0.png” file – this is the one created by the optimisation framework. Problem is, it’s 33% larger than the original files combined. Yes, I know, it’s fewer HTTP requests and on balance, would almost certainly be faster, but still, it just seems wrong. Admittedly the images were all well optimised out of Photoshop to begin with, but still, growing by a third? And this framework was one of the better performers in terms of final image size; I tried a number of others and the results were even worse.
And it is a bit wrong, because if you then take this image and Smush.it, it shrinks rather rapidly:
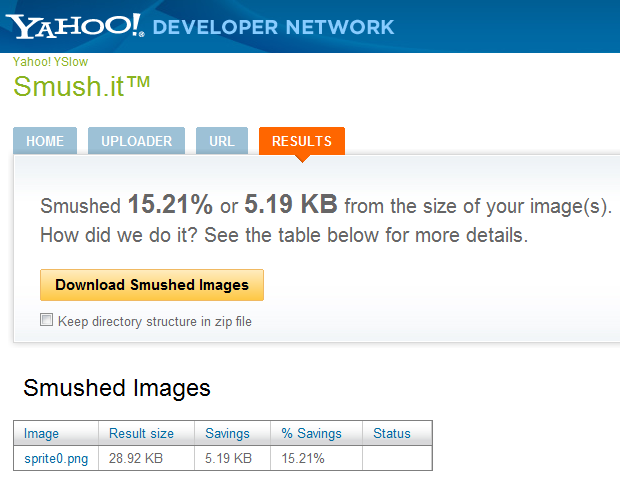
Ok, it’s still larger than the originals but when we’re talking about this level of optimisation, I kind of expected it to be better optimised to begin with. Now I can’t see if the optimisation has been achieved by pulling out quality, to my eye at least (and I do tend to be pretty pedantic), there’s no visible loss of quality.
Anyway, the point of all this is that the optimisation framework has helped create some data URI schemes, a sprite which I then optimised further and of course all the CSS required to properly position and display that sprite. Once it was done, I just needed to manually piece things together the way I wanted.
A bit of trial and error lead to this:
- Use data URI schemes for the repeating background images. They’re tiny, easy to drop into the existing CSS and non-essential if a client can’t load them.
- Generate the sprite for the remaining small PNG images and manually use the styles generated by this in my existing CSS (i.e. copy and paste).
- Smush the sprite from the previous step to get it down to a reasonable size.
- Any animated GIFs (I have a couple for “loading” sequences), or larger PNG files (the page background is 280 x 814 pixels), remain as standalone files.
That’s all great but one more thing we can do to minimise requests is to take a look at the two CSS files. A couple of months back I talk about using normalize.css to establish a consistent behavioural baseline across browsers. I kept this file separate because I wanted to easily update it in the future. Problem is, this creates an additional HTTP request. Bottom line: I’ve combined it with the existing CSS file with the normalize content up the top. Same end result, one less HTTP request.
Then there’s minimisation. The idea is that CSS and JavaScript are notoriously inefficient. All those warm and fuzzy line returns and indentations work great for us humans but they’re wasted space over the network; the browser doesn’t care for them one little bit. Same deal with JavaScript variables; all the clean code logic in the world in terms of naming means nothing to the browser and only screws with your bandwidth usage.
There are a bunch of different minimisers out there, but Yahoo’s YUI Compressor is consistently rated as one of the better ones. Let me demonstrate; here’s the first few lines of ASafaWeb’s .js file:
function PostInvalidViewState(path, target) {
    var form = document.createElement("form");
    form.setAttribute("method", "POST");
    form.setAttribute("action", path);
And here it is again, after YUI Compressor has had its way with it:
function PostInvalidViewState(d,c){var b=document.createElement
("form");b.setAttribute("method","POST");b.setAttribute("action",d);
No more line returns, no more indentation and even the parameters on the method plus the “form” variable have all been converted to single characters. Legibility nightmare, but functionally identical.
Similar deal with the CSS. Here’s the original:
body
{
  background-color: #1F1E1E;
  font: .8em Verdana, sans-serif;
  margin: 0;
  padding: 0;
  color: #9A9898;
}
And now the minified version:
body{background-color:#1f1e1e;font:.8em
Verdana,sans-serif;margin:0;padding:0;color:#9a9898}
Even the spaces between attribute and value are gone; they’re literally wasted space (ok, bad pun!)
Minification is great, but you have to keep the originals if you ever want to work on the files again. I just created a little batch file to do all the work above (combine the CSS then minimise it along with the JS), and insert a “.min” after the file name.
In the case of the CSS, here’s the bottom line:

Taking the normalize.css, whacking it up the top of the Site.css then minifying it all and saving it as Site.min.css has more than halved the total size! Not only that, but we also get one less HTTP request. Happy days.
Re-measuring
All of the above accounts for nothing if we can’t make measureable gains. Here’s the end result:
The original 19 requests: now 12. That’s a very good start. But let’s look at the detail:
It’s easier when you see a direct comparison of the really important bits:
We know why the requests have dropped and the bytes sent drops for a related reason; each request includes header data such as your browser, your chosen (spoken) language and any cookies the site has set. Reduce the requests, reduce the data being sent.
Bytes received barely changes and the answer for that is in the inefficiency of the sprite. Even after smushing it, it added bytes which we’ve only just overcome through minimisation. It’s still a net reduction in bytes, but the reduction in requests was even more important.
But the big one – the only one which truly matters – is the duration taken for the whole shebang to load. 20% folks – that’s not small change! And remember, that’s 20% faster on a pre-optimised, “A” grade performance site!
That’s a very pleasing result.
Summary
Everything above is highly variable; network speeds go up and down, different browsers behave differently, there’s still render time to consider, there’s life beyond a cold load (nothing cached), etc. etc. But when we go back to the context I set at the outset – the one about not pre-optimising with a CDN – I hope the point is now clear. A very well optimised site which already implements HTTP compression, minimal requests, will optimised images and even uses a CDN for a few requests can still make a 20% gain from just a couple of hours of smart optimisation.
The CDN is your next step. It may well get another 20% – or maybe only 15%, maybe 25% – I don’t know. But what I do know is that it will cost you a shed load more than a couple of hours of development time. This is now the realm of exponentially increasing time and dollars for the same gain and this is where you want to be at the end of your optimisation folks, not at the beginning.
Oh, and just in case you’re not convinced of the value of this exercise or you’ve forgotten what it feels like to have a dismally slow connection (or you’re too young to have experienced the joy of internet over 56kbps), try setting Fiddler to simulate modem speeds and browse around for a bit. ASafaWeb now fully loads in 14 seconds – you won’t get that on too many other sites!