Earlier today, Have I been pwned (HIBP) appeared on a British TV show called The Martin Lewis Money Show. A producer had contacted me about this last week:
I Just wanted to get in contact to let you know we're featuring 'have I been pwned?' on the programme next week (Monday 28 Nov, 8pm, ITV) saying it's a good way to check if your data has been compromised. I thought it best to let you know in case you need to put extra resources onto it, we do have a tendency to crash websites with traffic!
I get this a bit - people saying the site will be featured or that they'll be hitting the API a lot or something to the effect that I need to prepare myself. I almost always barely see a blip, but just to be safe I scaled up from my normal S2 website instance on Azure to an S3 with double the capacity. I put a note in my calendar and kept an eye on my analytics when the show went out. I initially saw dozens of referrals from moneysavingexpert.com and assumed it was the same old story: "big" traffic is relative. Then, within about 60 seconds, the simultaneous users on the site went from about 200 to this:
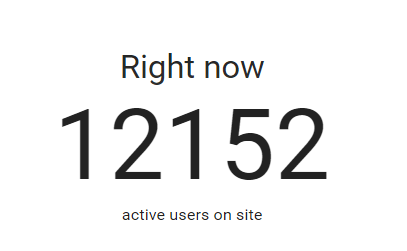
That's about double the highest volume I'd ever seen in the past. Here's some brief points about how the service handled it and what I learned from the event.
Autoscale can only scale so fast
I use Azure's autoscale feature which is configured like this:
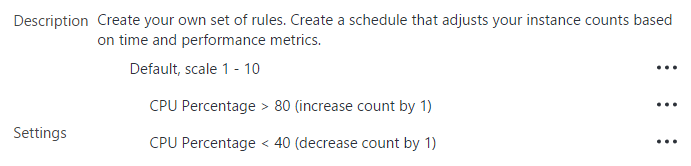
Get too much traffic and HIBP scales out with more instances of the same web server. Thing is though, this isn't "point in time" insofar as that 80% CPU utilisation needs to be sustained for a period of time:
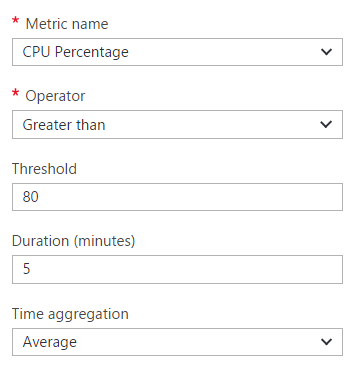
If the duration is too short you get yo-yo'ing where you continually have instances being added too quickly then taken away because there's one or two process-intensive requests running. Scaling too early costs money; I'm paying by the minute with Azure websites. All this works great for organic increases in traffic to even very large levels, but not so well for sudden, massive spikes like this:
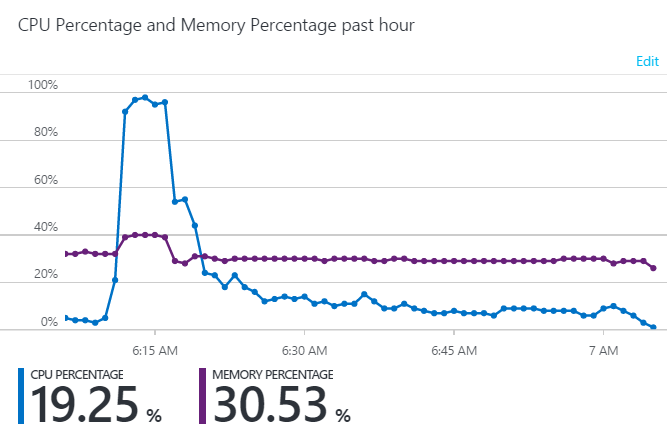
The only reason that graph comes back down quickly is that I manually added another 4 instances when I realised what was going on.
Traffic loss is inevitable
This is the harsh reality: if you want to use autoscale and you don't want to be perpetually over-provisioned, there will be times like this where traffic will be lost. Here's what happened earlier today:
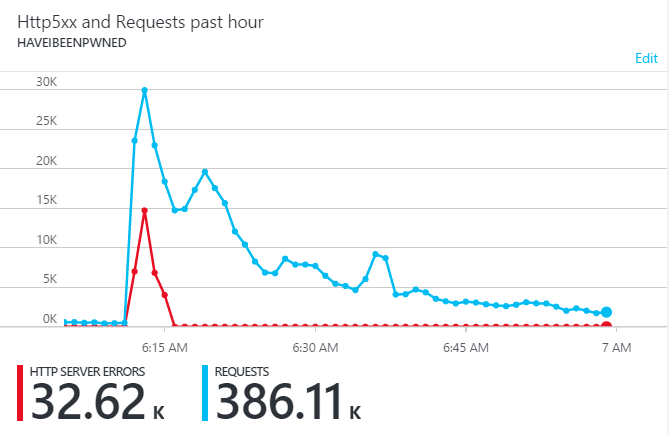
Fortunately, there's only a few minutes there where there was any loss at all, but it still happened and that's a bit disappointing. But it's also the reality of unexpected success and I'm ok with that. Often people will have solutions along the lines of "well if you'd used this service / framework / pattern it would have been fine", but the simple reality is that whilst you're dependent on underlying infrastructure that's capacity bound, this will happen. The "serverless" model such as Azure's functions I've written about in the past promises scale beyond that so I'm pretty keen to see the promise of that come to reality in the future.
Sudden good traffic can look like sudden bad traffic
Part of the problem too is that from a pure traffic volume perspective, it can be difficult to differentiate wild success from malice. A little later on in the day I saw this:
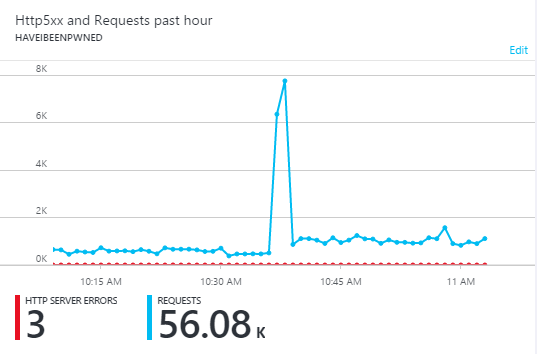
This is malicious traffic and although not quite at the volumes of the good traffic earlier on, that pattern is remarkably similar in that we go from a steady state to a massively higher volume in an instant. The only reason it comes back down again so quickly is because my Azure Functions implementation blocks it at Cloudflare. But you can see the challenge, I'm sure.
Offloading traffic to Cloudflare helped massively
Take that earlier graph with the server errors then compare it to this one from Cloudflare:
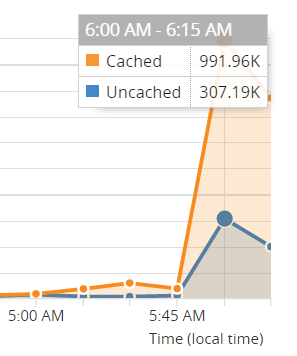
Yes, I lost some traffic, but it could have been far, far worse. Cloudflare actually absorbed 76% of 1.3 million requests in a 15 minute period. Think about that - I could have had 4 times as much traffic hit my site during that period without Cloudflare and that would have had a profound impact on the number of requests that were dropped.
One of the reasons they're caching so much is that I configure page rules as follows:
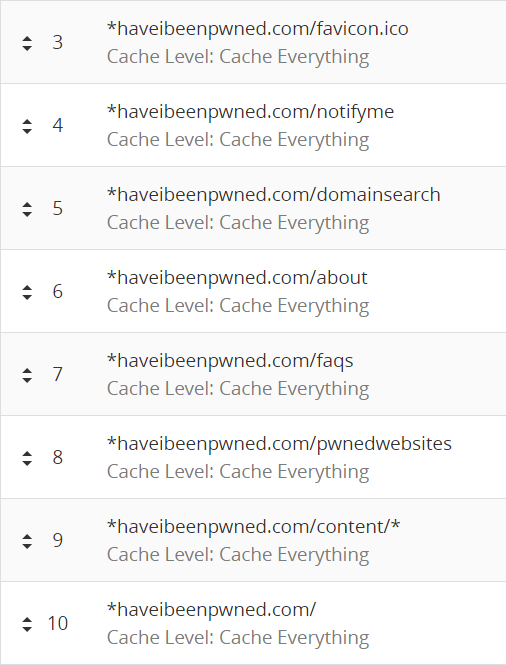
That last one, for example, caches the homepage so a huge number of requests to the root not only don't hit my origin website, but are served up from one of more than 100 "edge nodes" Cloudflare has around the world so people get it super-fast too. That doesn't mean that every request comes from cache, they still occasionally pull content from the origin and if it goes down then you can still have problems.
You get this for free on Cloudflare and that's a really important point to make. This is a case where using their service without spending a dollar actually saves you significant amounts of money because that's a lot less infrastructure you need on the back end. I saved a bunch in bandwidth too:
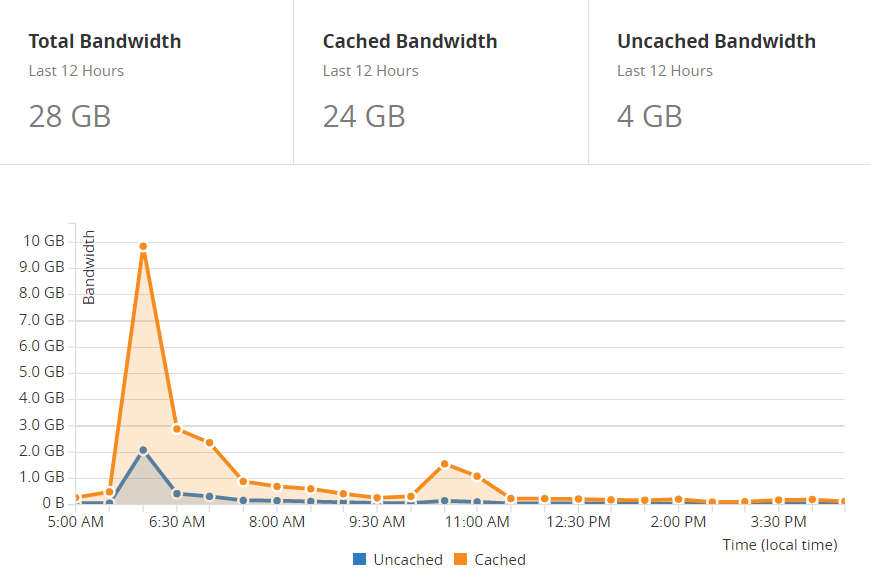
That's 20GB of cached bandwidth in 12 hours right there which is small in terms of dollar terms, but sustain large amounts of traffic and the cost of that can start adding up.
Don't serve what you don't have to
A long time ago now after a very early experience of high traffic volumes, I realised how valuable public CDNs are for serving libraries like jQuery and Bootstrap. In fact, back then I lamented that I'd served 15GB of jQuery alone. It's not just the bandwidth costs of doing this, it's the fact that under heavy load situations, while the server is returning those JS files it's not able to do other things.
Use public CDNs like Cloudflare's to serve this content. If you're worried about tampering of the files then use subresource integrity attributes as well. It's all just part of offloading everything you don't need to do.
Measure the experience users receive
It's easy to get very focused on how many requests were served versus dropped in scenarios like this. But of the ones that were served, how fast were they served? And how did that impact the user experience? That's why stats like this from New Relic are great:
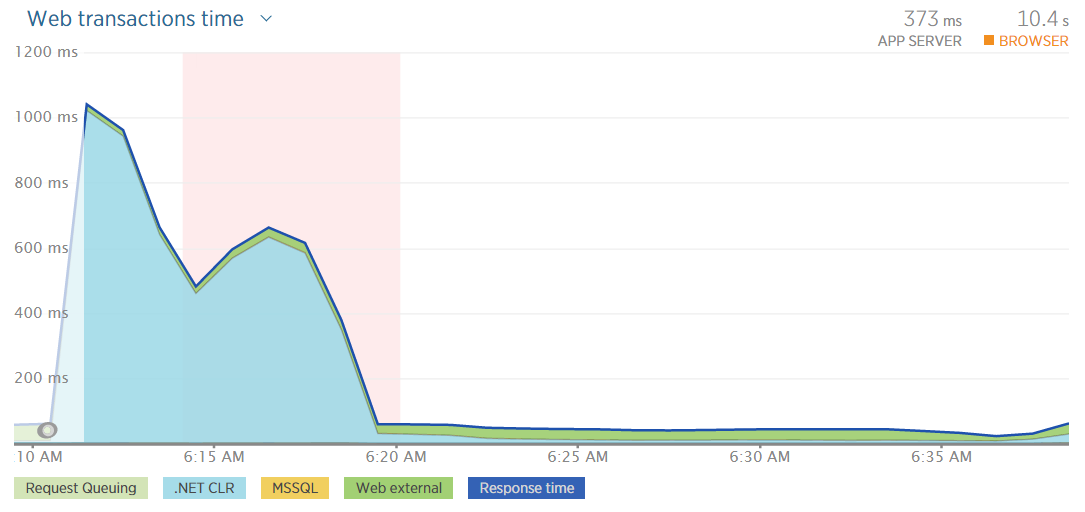
I could still be serving requests but if I see the response times getting up near a second then I know I've got issues. It's a similar deal with their apdex score:
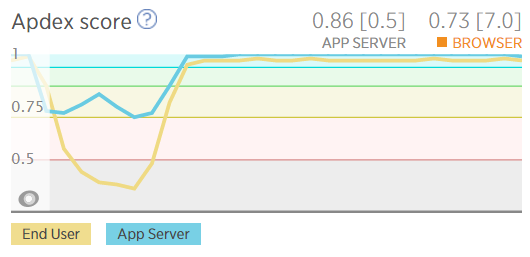
This shows user satisfaction dropping as everything slows down.
Get told as soon as things go wrong
Alerting is absolutely critical and the first inklings I had that something was up came via Twitter:
@troyhunt more coverage #UkMoneySaving pic.twitter.com/zwjkNFfo6j
— GaryMcAllister (@GaryMcAllister) November 28, 2016
As good as Twitter is for early warning, it's not particularly reliable! New Relic was the first to let me know something was up:
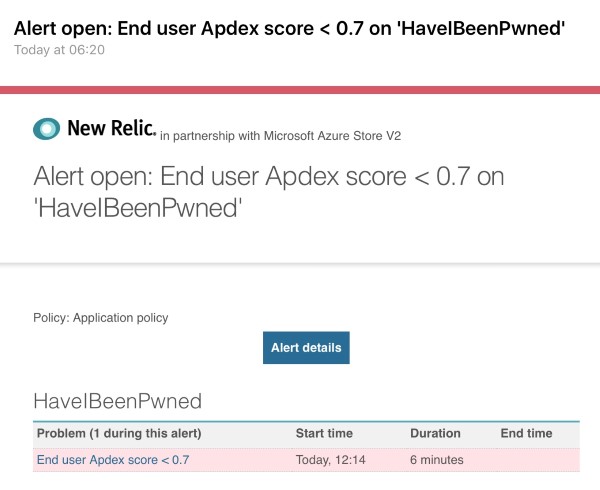
Thing is, alerts like this are always sent after stuff is going wrong! I have alerts that tell me when things get busy but that only helps avoid outages when ramp up is gradual and you can respond in time, not when tens of thousands of people simultaneously land on the site. The alerts are valuable, no - essential - but in cases like this, that's mostly to help you fix broken stuff.
What I can do better
I'd love to break out the website itself and the API back end into fully autonomous units. Because they all run on the one site at present, when things are overloaded then everything goes down. I'd love to use Azure's API Management service but unfortunately at my scale, it's just not financially feasible for a free service like HIBP.
I'd also love to geo-distribute the service which is easy to do with Azure Traffic Manager. This would ensure that big traffic from, say, the UK doesn't bring down traffic from the US. But it's a cost issue again because obviously I'm now running multiple instances of the infrastructure.
But more than anything - and this is what's bugged me throughout the day - is when someone says "we're going to send you a lot of traffic", overcompensate then scale it back later. And it would have been so cheap to do too...
Summary
I could have easily handled this traffic spike and the bit that really frustrates me is that I could have done it for 40c. A mere $0.40 is what it costs to run an S3 web app service for an hour on Azure and looking back at the traffic, that's all it would have taken. Probably less actually; I would have only needed it for about half an hour!
But it's easy to play the "how much is enough" game in retrospect, much harder to do it when planning ahead. The traffic could have been triple what it was, it could have been nothing, it could come totally out of the blue and certainly that's happened before too. If I was running this as a commercial operation then it would be easy - I'd just over-provision all of the time. Running it on a shoestring is a different story though as I'm always trying to get as close to optimal as possible and that means that sometimes, stuff like this is going to happen. But because it's primarily a free service it also doesn't really matter that much that I lost traffic, it's just the perfectionist in me that's unhappy.
Oh, and for people that are interested in what the coverage was that caused all this, the show is now available online (about the 8 minute mark). You need to be in the UK though, if only there was a way for overseas visitors to "be" somewhere else...